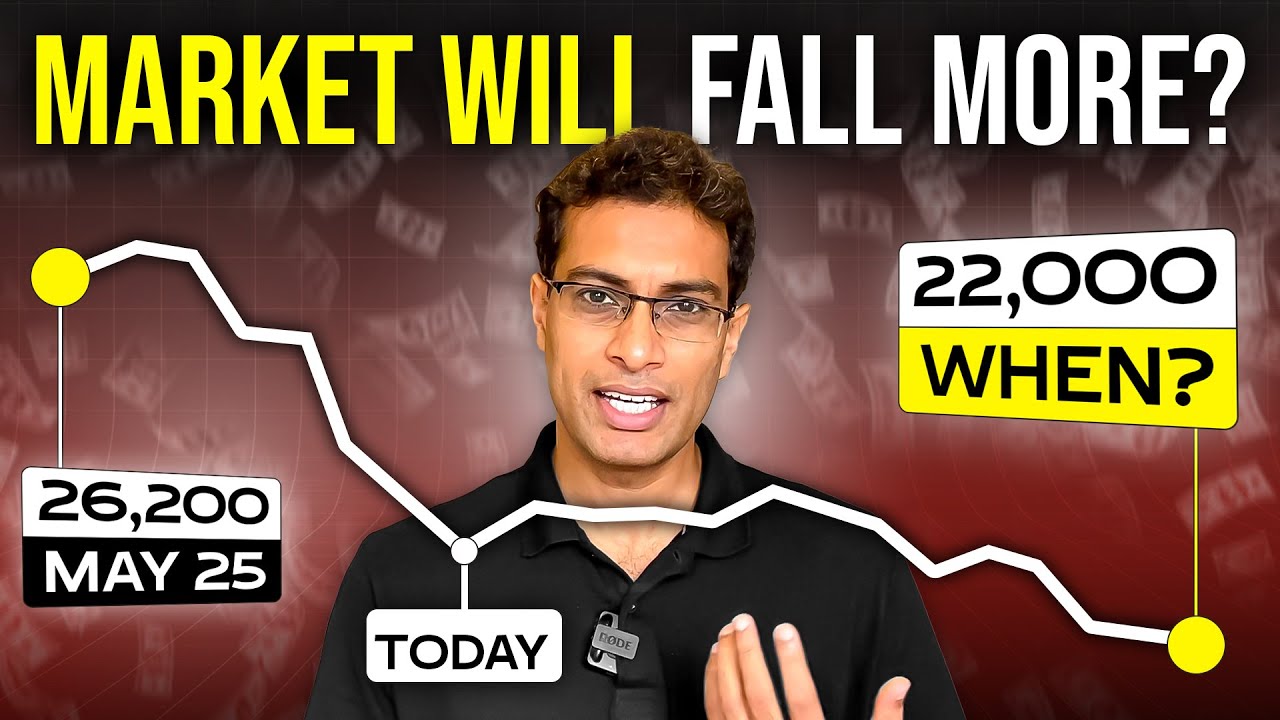
hi this is kri artech with Wicked stocks bringing you your daily Tesla report for Thursday November 14th 2024 let's take a look at the charts I am going to start with this one um this is our weekly chart uh we pushed through this formation certainly early in the week we've now been back below the last couple of days yes we pushed back above it intraday on Wednesday but we closed below it and as long as that remains a fact in other words as long as we close below 33682 tomorrow essentially the end of the week
but you know if you look at the daily chart and I can show that right here you can see how you know was this Monday was the um uh the the rally uh we held it held the lows and then we I'm talking three 3765 and then we broke back below it on Tuesday closed below it closed below the low of the high closed below the channel top I see the directional Dynamic is skewing South now I think the risk is to the downside um and so you know what are the price points on the
way down I do think uh if you're long right now and we happen to close for instance today below 32196 that is your next signal to exit a long position uh in fact if there's any position to be made right now and I understand waiting for the week to flesh out is fine but this sort of uh the makings I should say of a blowout top where we we Gap above uh this channel top we close clearly above it in the buy Zone at least on the daily chart not yet of course on the weekly
chart uh but we close above it on the daily chart and then the very next day we fall back and close below it that is the makings of of a good high I'm not saying it's in I will say if we close was today below 3297 actually I lowered the number to 32175 Just for slippage factor and so it really does come down to the weekly Channel top at 32175 if we close below it uh today I do see a bearish continuation uh back to uh where is the mapped out area a 29929 this could
be within this would likely be within 1 to 3 days it could be the very next day given the presently incredibly heighten volatility but let's call that a 1 to three day sell off to 29929 so it is stair step on the way down but the overall emphasis remains one of either a not being in a position at all kind of a wait and see uh or B you're short uh below 33765 anticipating actually over the next you know two to 3 weeks the mid 270s low 280s in climbing this newly formed Trend defining Rising
1/3 Speed Line and this former Channel top correlates well with the old high and the lower 270s I believe this was there's just a lot going on the chart there's some Fibonacci retracements 38 Fibonacci uh from the uh low earlier in the year April against the recent High etc etc etc so holding below 33765 will keep 27423 to 28260 in reach over the next 2 to 3 weeks and if over the coming week or two we were to close below 299 uh 29 we may just be 3 to 5 days actually away from testing uh
the 27423 to 28260 region and so you know if we're talking day trade uh right now and let me find the right chart and this says a lot a 321 97 I've lowered it to 32175 for the weekly chart you know we could bottom out here again rally back to 33765 up out there for the day um fall away again uh and if we do close below 2175 today uh I do see 29929 in reach over the next 1 to 3 days and this is an old high you know this goes this and it held
for a long time so but I have reduced it to session containment because I really don't want people getting hung up on a long position when they may actually have to in the end endure heat all the way back into the mid 270s low 280s and I do see this lower area as a solid buy Zone as a solid buy opportunity through the rest of the year and from here within 2 to three 3 to 5 weeks we can round back up to 33765 we would have a longer term sell signal if we did close
below 27423 that should play out well into the first quarter of next year but there's no sense in going there uh right now now for the upside you know on an intraday basis and I don't show it I probably could zoom in here but I I don't have any charts that zoom in this area here but I will say that if we push through 3376 5 350 even is in reach today that is the high settlement price that was put out on Monday um that can contain buying possibly for the balance of the day if
we push through 350 even 36060 is likely uh and that can contain daily buying pressures and I forget the exact swing count if it's a B plus a or if it's a minus B I can't remember exactly but there is a wave count up here that we came very close a testing actually on Monday and it can contain daily buying pressures but I will say and I'm going to close with this that if we do settle tomorrow the week itself above the 33682 channel top buy a full 1% margin and this weeks that is tomorrow's
magic number is 34018 that would also of course be above the daily Channel top that we have at 370 I mean sorry 33765 so if we close tomorrow Friday the week itself 34 408 or higher uh we should see 41449 that November 21 High uh with present volatility this could be within 3 to 5 weeks with more recently restrained volatility this could be the better part of two months but over the longer Hall a settlement at 34018 or higher on Friday that is tomorrow I would anticipate the 499.99 long-term Channel top that is essentially a
four almost fiveyear Channel top that I would expect you know this could be 2 to three month aggressive move uh this could take you know into the second third quarter of next year depending on how the market responds to 4449 do we put out a double top here then fall back to channel support uh this uh this channel top within a matter of a month or two before then rounding back up again that is the scenario potential scenario that I see developing if we close today not today tomorrow Friday 3418 or higher and then we
have a clear Buy Signal uh really to 500 let's just round up uh over the next you know is it 3 to 5 months or is it the the better part of a year hard to say uh I think that pretty much rounds it out please click like share subscribe check out wiked stocks.com we offer two stock picks a week that you can uh take a look at and you should also be seeing the NASDAQ 100 in triple Q right now uh of which this uh this stock is a big part of uh it's testing
a really important area area right now long-term price ceiling you should see this um you know it may give you more confidence to sell Tesla and inversely if we get a settlement tomorrow once again at 3418 or higher there's a decent chance the NASDAQ will also finish the week out in a long-term Buy Signal so uh have a look see for free 5-day free trial up front I'm going to leave it at that for Thursday's Tesla report I'll be back tomorrow of course with Fridays you have a great day