[Music] hello everyone welcome back to clinical research method today we will talk about the topics that are closely related to the data collection and preparation for later analysis research data are collected by measuring aspects of objects or events to describe what we are studying the collected data are typically stored electronically in some numerical format however they're not just numbers they're numbers with context which makes the data informative and meaningful in addition not all observations possess all the characteristics of numbers because the data are basic ingredients of statistical recipe to follow it is critical to correctly
identify the characteristics of those numbers assigned to each variable so that we can cook them properly so now let's take a look at some data how they are organized using statistical software for real okay because this is our first time uh using jmovie so let's just start from scratch um so before you open um any files you want to actually open the program first let's go to cloud.jmoview.org okay so this is the um the start menu so you just click it away and now let's go to gc learn to the data courses clinical research method
and a week so it's under week two and on the levels of measurement now this is excel sheet you do not open it but oh you can just click it to okay now so it's just a save somewhere um save or somewhere you can find that easy desktop save okay now i save this now i can go back to the chat movie um so open this device and desktop a double click hopefully open the data sometimes the cloud version is not very stable um unless you have a very strong internet connection but now here we
are so let's just oh so this is the cloud i can make it bigger like this so hopefully you can see it better right so as you can see here we have different columns of variables so this is actually the actual data collected about like a two years ago in the same module clinical research method um this was part of the coursework where students need to measure their own uncorrected visual acuity in their right eyes left eyes and both eyes and then i gave them like testing order here right the first column represents testing order
so s represents os u represents ou d represents od so i just give kind of random order um to minimize the order effect in testing their visual acuity so all these numbers here under otos oru represents log mark values right there are visual qt's uh measured in log mar unit right so these are actual numbers right so you can do any mathematical operations between these values but if you look at the gender variable right i don't know if you noticed it you have kind of a different icons you have so for visual acuity measurement you
have rulers right whereas for gender you have um some you know three circles um which is different from the visual acuity measurement so if you look at this um you see the gender here as a one ones and twos so here actually one represents male and two represents female so even though so except for this testing order this is text right so the type of data is text for testing order so this is different from other variables in terms of type of data that are that were that was collected right but if you look at
the gender even if the data are in the form of numbers do these numbers have same information like the visual cutis so that is the question right so here you know these one and two they don't really mean anything because they're just arbitrary number to distinguish different gender you know male from female basically right so you can't really do any mathematical operations between these two values under gender column right so that the kind of information you have in the gender variable is qualitatively different from the numbers used in the visual acuity measurement okay let's oh
my okay so it just comes back so that that's just as you know what happens when you use cloud version um anyhow so that that was the point right even though you have kind of a numbers as your data right but depending upon the variables right or the kind of you know data you have these numbers don't have the same meaning right so for that matter we're gonna look at the different types of data or the different levels of measurement in more detail later in the lecture as we just have seen not all the numbers
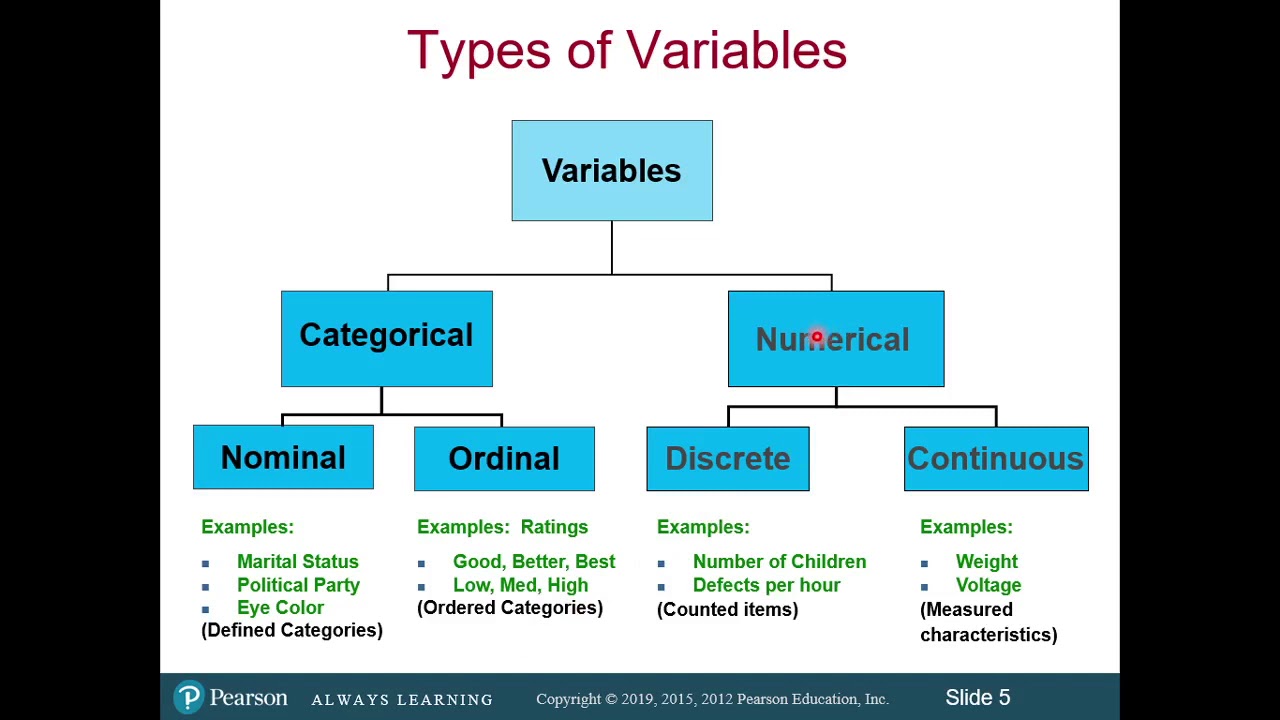
contain the same amount of information depending upon the amount of information a datum possesses a measurement variable can be categorized into four different levels of measurement here the levels of measurement is a general classification to describe the nature of information within the numbers assigned to variables in some cases the boundaries between the levels may not be so straightforward but many times this is often a very useful scheme to identify and classify the variables to properly analyze them later on so i strongly suggest that you get used to this scheme for what's coming later as identifying
the correct level of measurement is critical for a later analysis so our first level of measurement is the nominal level of measurement also known as categorical level of measurement the type of data collected for this level of measurements are in the form of names categories or qualities for example let's say that you want to collect the data on the secondary schools in glasgow that your classmates attended then the values you can assign to the variable are like glasgow high barristan academy or douglas academy and so on if a nominal variable has only two categories then
the variable has a special name called a binary or dichotomous variable a representative example would be gender where there are only female or male as possible values you can assign to other example is a handedness left-handed or right-handed even though humans have two eyes the iq profession has developed a very unique system to indicate which high they measure according to this system you can assign three values to the i variable so od for right eye os for left and ou for both eyes so categories in this level of measurement are often assigned numerical values but
the choice of these values are completely arbitrary for example we can assign one for male and two for female to simplify the gender data well how about three and four five and six so basically you can just assign any arbitrary values so it never matters whatever numbers you sign as long as they are different numbers because they are arbitrary no arithmetic operations including ordering between different values or categories are allowed even when the data are recorded with numbers instead of words for example say now you assign 1 for female and 2 for male this time
do you think you can add those two numbers to get 3 well i don't think so because that means you are adding male and female then what's the outcome of the addition a baby well that makes three but what if you have twins or triplet with all the jokes aside i hope you see what i'm getting it right so also you cannot rank all of the categories in any directions so say now you assign one for male and two for female does that mean the male is better than female whatever that means just because male
is assigned to one i hope you don't answer yes to this question unless you are a sexist so the only possible operations on the values of nominal variables are counting meaning that you can only count how many times each category occurs which is a statistic called frequency another possible operation for the nominal level of measurement is to compare whether any two categories are identical or not for example a male is same as other male as long as they are males and a male is different from a female and when two categories are different um though
usually nothing can be exactly said about how they differ and how much they differ so the next level of measurement in line is the ordinal level of measurement that has more information than the nominal measurement so this level has all the properties of normal a nominal measurement plus ordering information between any two values however we still can't cannot tell anything about the nature of the difference between any two values from this level of a measurement again numerical values are often assigned to this level of a measurement but still no arithmetic operation is possible as any
two consecutive values do not have the same interpretation throughout the scale so a typical example of an ordinal level of a measurement is probably the end point so n number of point rating scale you may have seen a lot from the customer satisfaction survey here we have a five point rating scale to rate how much the respondent agrees or disagrees to the provided statements there is an obvious order between the values of this scale as you can see but it is not known if the difference between any two consecutive values or ratings for example between
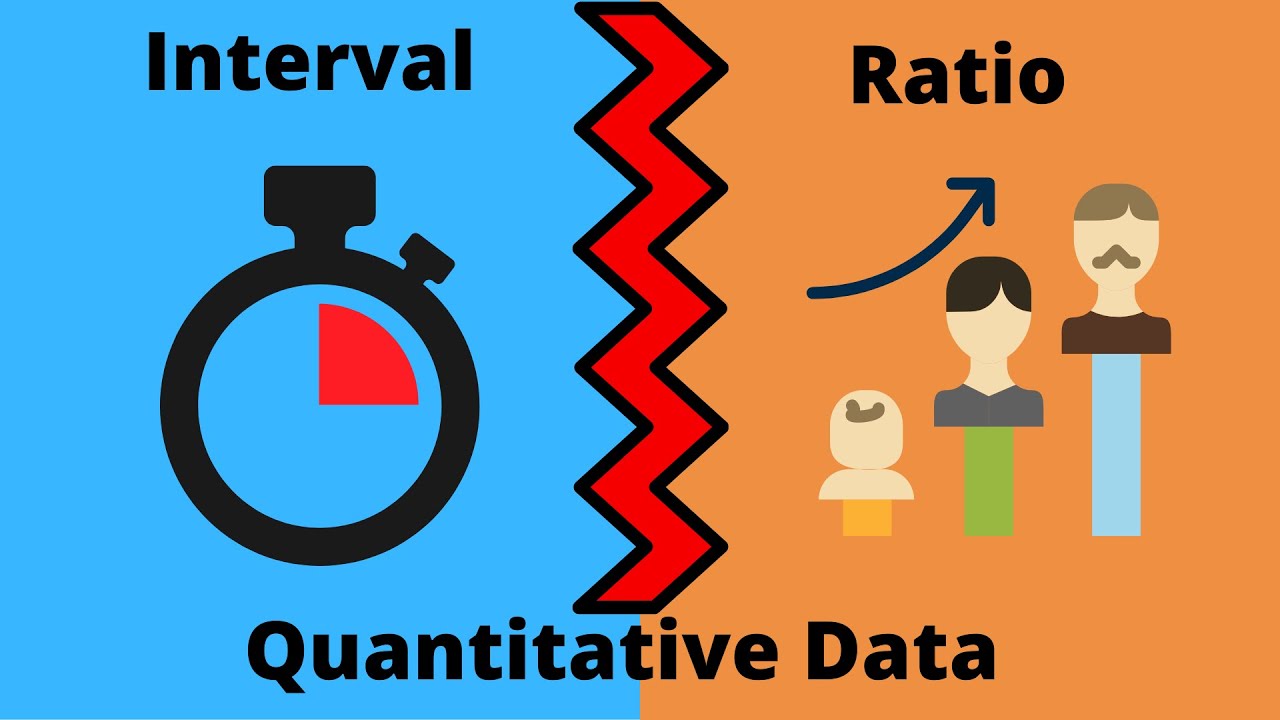
the neutral and agree is necessarily same as the difference between the dcv and the neutral this is the table of visual impairment categories based on the international classification of diseases 10th revision published by world health organization also known as who here numbers are signed to denote the degree of impairment in ascending order but if you look at how each category is defined you wouldn't say that the differences between the categories are consistent throughout would you now the interval level of measurement has all the properties of nominal and ordinal levels of measurement unlike the ordinal interval
level has a numerical scale where differences between any two consecutive values are same throughout sometimes an interval scale includes the value of zero in its scale but this zero here is not the absolute zero representing the true absence of the property magnitude strength or intensity that the scale is meant to measure so one of the very well-known example of the interval level of measurement is temperature measured in celsius as you can see from the picture we can see that the tick marks are all equidistant to each other and the scale includes zero in the middle
however this is not a true absolute zero because zero celsius does not mean the absence of temperature it is just a relative position between hot and cold as there is no absolute zero in this level of measurement in theory direct multiplication or division between the values of interval level of measurement is not meaningful however people perform such operations quite frequently in practice with interval level of a measurement even though what's truly meaningful is the ratio of differences only any cyclic data such as time of the day or angle of an arc in degree are other
examples of the interval level of measurement finally the ratio level of measurement is at the top of all the levels of a measurement this level has all the properties of the previous three levels plus absolute zero so which is a unique and non-arbitrary so the absolute zero here represents the theoretical absence of the quantity or property you are measuring for example when the variable body weight is measured in kilogram then the zero kilogram here can be assigned to mean the complete absence of weight even though we know that it does not actually happen in real
life categories from this level of a measurement have all the arithmetic characteristics of numbers so any arithmetic operation is allowed now that you learned about all the levels of a measurement you should be able to classify your data into one of the four categories in practice right well it may take some time to get used to this but you'll get the hang of it in addition to identifying the proper level of measurement for your collected data in an experimental research there is another practical consideration you need to take account into which is the errors in
measurement so you probably agree that no measurements are free from error so and it does happen so it is very important to characterize and manage these errors when we measure something to collect the data in doing so we need to understand how these errors are characterized and reported with the exception of obvious human errors such as finger errors measurement errors due to other uncontrollable and unknown sources are statistically characterized by two quantities namely accuracy and precision to establish these two quantities repeated measurements per sample or subject are strongly recommended which is called a technical replicate
so what i'm going to show here is a sample of technical replicates generated by one of the eye care tonometers which are portable handheld devices used to measure intraocular pressure so compared to the old goldman tonometry measuring internal pressure gets much easier than ever with this type of devices so in this high resolution slo-mo video the device measures intraocular pressure with a tiny probe by gently drumming down the cornea six times in a split second and it will provide the accuracy and precision of the given measurement even though they're used entertain interchangeably in everyday language
as if they are the same they actually mean different from the context of metrology which is the science of measurement in a stricter sense accuracy represents the degree of how close a measurement is to the true value which is typically unknown to us that we try to estimate when your measurement is far away from the true value then your measurement is called biased however knowing this quantity alone is not enough to describe measurement characteristics of a device because accuracy alone does not tell us how reproducible or reliable a measurement is therefore we need another component
of errors in measurement called precision so precision is defined as the degree of how close a set of measurements is to each other given that they are obtained in exactly the same manner the concept of precision is closely related to reliability of a measurement and the opposite is a variability of a measurement sometimes precision is confused with the measurement resolution but they are different in that the letter represents the smallest difference that can be meaningfully distinguished by the measurement now we can use the target and shoot a metaphor to illustrate the difference between the accuracy
and precision visually for example here we have a red target and shooting results are represented by the black dots the aim of the shooter is the very center of the concentric target so let's say that this is the shooter one and nearly needless to say we can all agree that this shooter is very accurate as well as precise because all the shots landed at the center of the target and they are very close to each other on the other hand what about the this shooter too number two unless she or he aimed at the corner
on purpose the average location of the shots are actually far from the center however we can see that the shooter is at least quite precise as all the shots are very close together no matter how far they are from the center so what is possibly going on here would be that the gun is not calibrated well now this shooter is less accurate compared to the first shooter but better than the shooter 2 in terms of accuracy as the shots are more or less scattered around the center however precision of the shooter is less than the
previous shooter 2 as the shots are more spread out and finally whoa look at this of all the shooters this one is the worst in terms of both accuracy and precision the shots are all over the place and i can call this a shooter a lousy shooter we can characterize the accuracy and precision in a different way imagine that you collected hundreds of measurements of something say like iop ventricular pressure from a single subject using a method and plotted them on a graph like this the type of graph shown here is called a histogram where
the horizontal axis represents the measurement values and the vertical axis represents how frequent each measurement value appeared a single vertical line on the right here um that um represents the location of the true value we're trying to estimate and from this representation at the center of the histogram in green roughly represents the average of hundreds of measurements and the accuracy is estimate estimated by the distance between the true value and the average measurement whereas the spread of the histogram in red represents precision so from this we can call this measurement as inaccurate as well as
imprecise as the distance between the true value and average and the average is quite far away each other and the distribution has a large spread on the other hand the method two so you measure the same entropy pressure but using different method two now it looks like a more precise than the previous measurement as the spread of the histogram is narrower than the first one however the method is still inaccurate as the distance between the true value and the average measurement is large and now you use another different method three and now it looks like
it's accurate in that the average measurement is now very close to the true value however the method is still imprecise as the spread of the distribution is quite large and finally the last method is precise as well as accurate compared to all three previous methods as the location of the average is almost right on top of the true value that we're trying to estimate and the spread of the distribution is also narrower than all the other methods so i hope you now understand the difference between the accuracy and precision of measurement now to the summary
of the section [Music] so you