what's going on guys welcome back another video of price session trading and today we're going to talk about what to really do when you don't know how to trade the market you are very confused with the current price section you cannot really identify what's going on you're fairly confused because if you're just starting out trading there can be a lot of information you know coming at you from the market and you cannot really dissect it the way you want to so normally you know we are trying to identify the what the market structure is looking
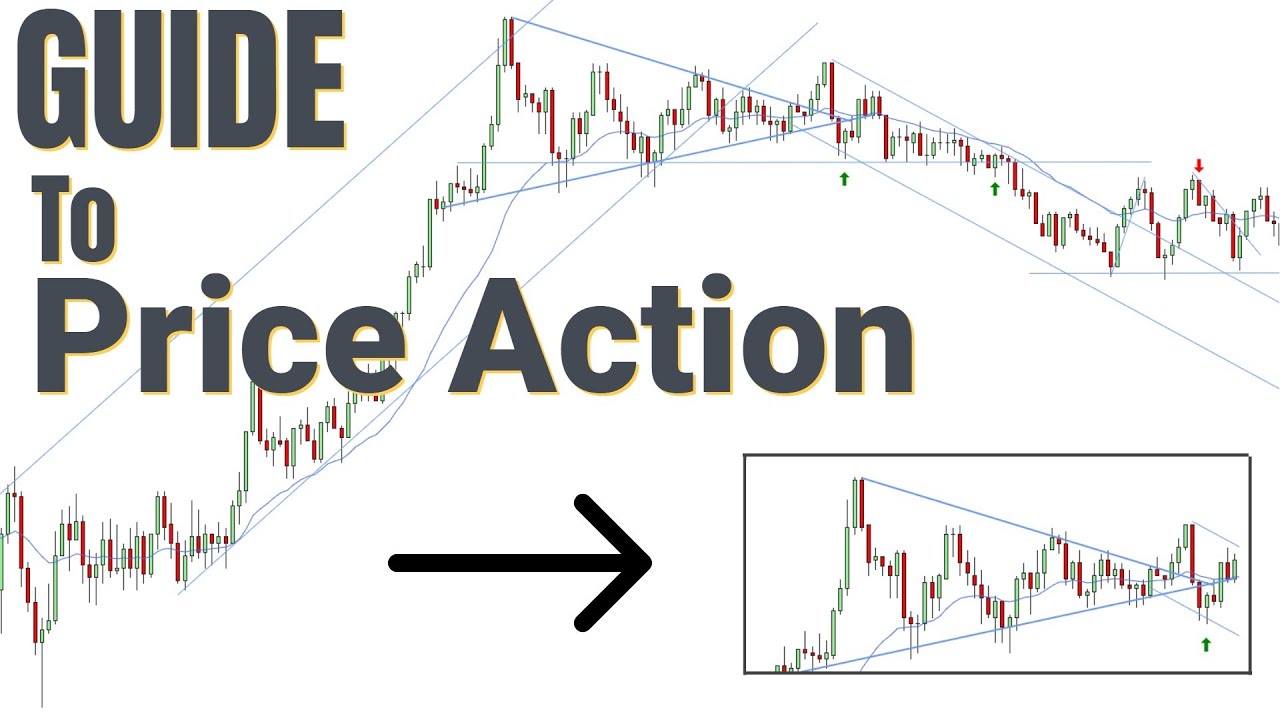
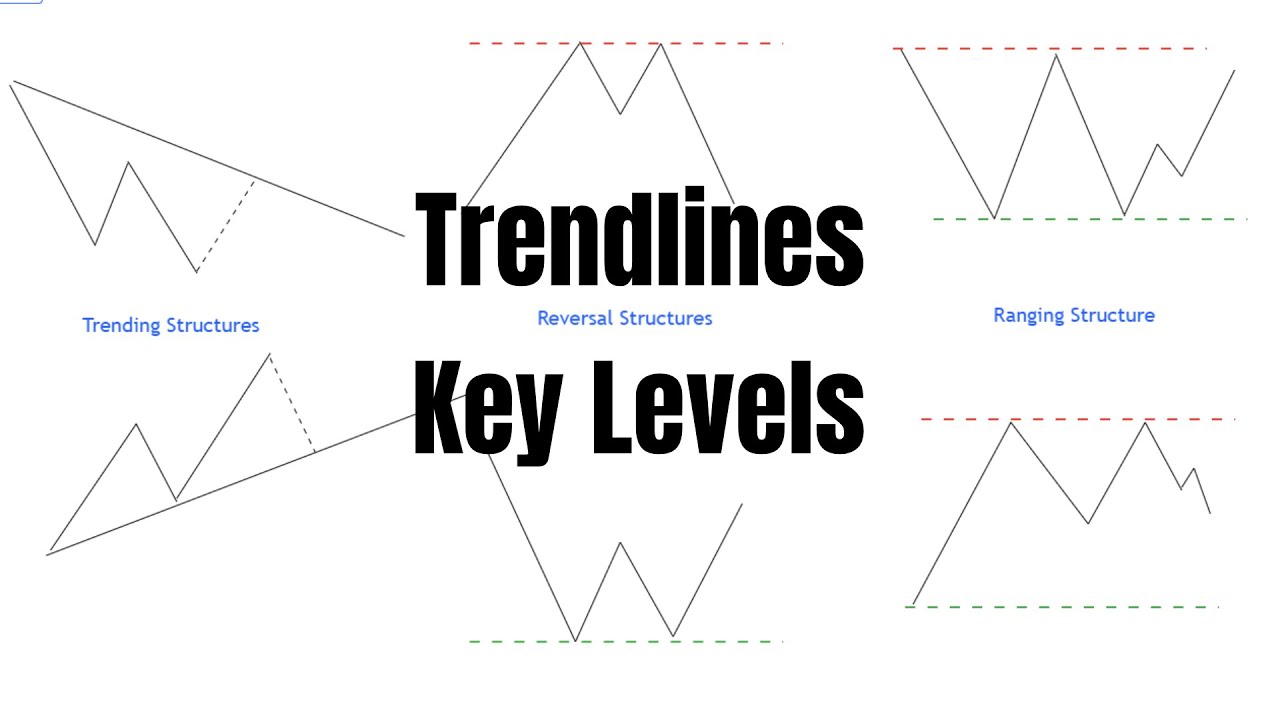
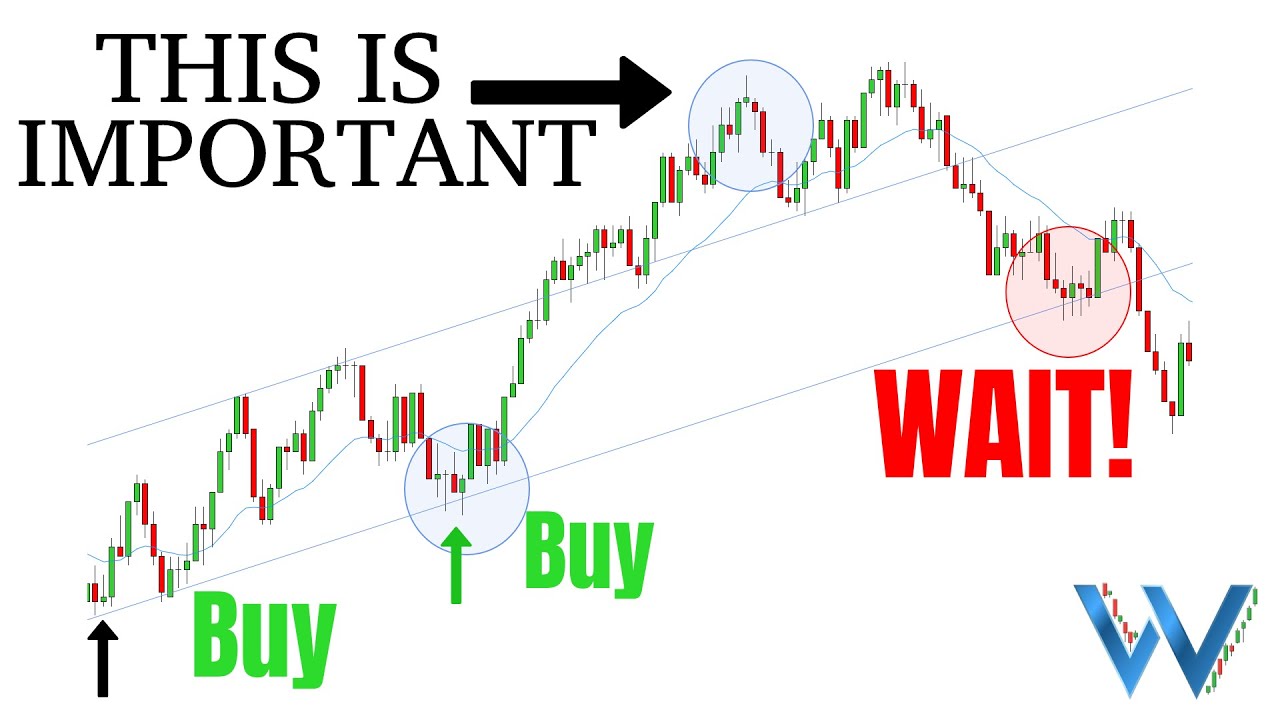
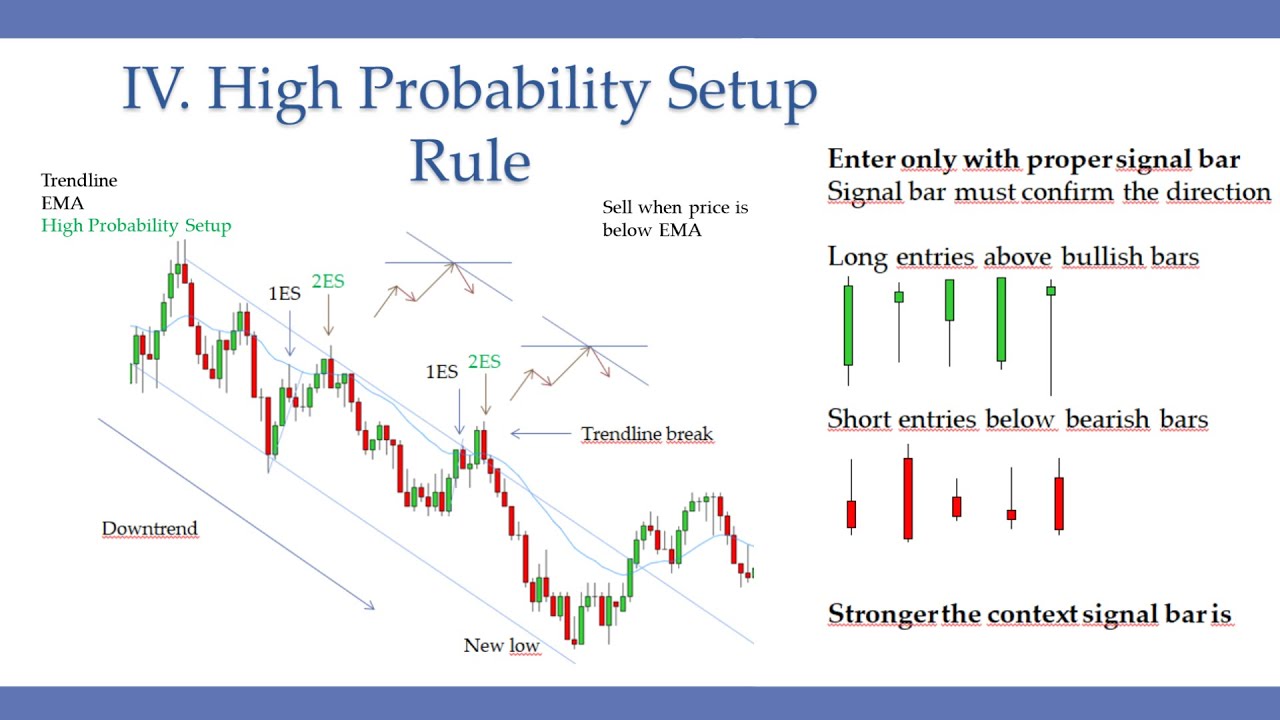
like we are trying to find the bigger patterns the bigger trend lines it is a trade it is a trading range day it is a downtrend or an uptrend but there are days where it's very hard even for experienced traders to really know what exactly is going on and the only solution to stay on the right side of the market and to really not get rolled into bad trades is basically to draw the shoulder turn trendlines and follow the shorter term trend lines rules it's going to recap it the trendline rules are basically saying that
after the break of a trend line there is most likely going to be a retest of a new extreme so just as an example we are working in a downtrend lower prices broke the downtrend bull dungeon bearish trend and made it two lakhs to a new low let's measure these lags usually the lags can be measured this is not quite measured but as you can see these are two lags to a new load so from this point on when prices break the trend line and we made a new low especially two lakhs if you made
one lag to new load there may be some momentum still going in that direction but after two lacks will be low now there is at least a correction or maybe straight up reversal and the same thing happens in an uptrend like this prices are working higher you can find a trend line from the first few swings and prices are fitting neatly this is the key to shorter term trend lines with whenever you're trying to find the bigger channels you can kind of get away with prices not fitting perfectly but when it comes to the shorter
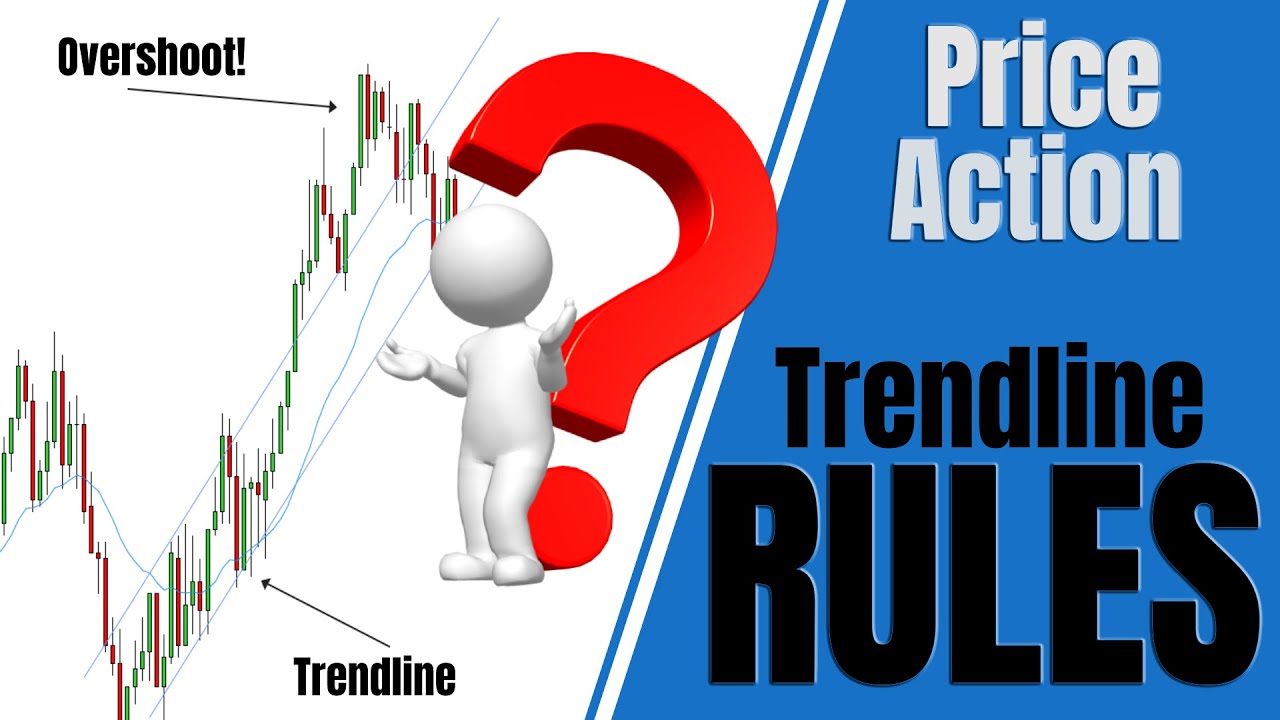
term trend lines you really need to prices fit nicely and you need prices to be hugging you know the chan the trend lines perfectly so just take a look how i drew these and pretty much all of them or at least most of them played out you can see this bullish correction working higher break two legs to a new high now it's time for reversal we're working lower we spiked through ema break big massive move to new low we reversed from here we're working higher brake new high this was the only time we didn't get
a break and a new low and and there's a reason for this as well i'm going to get to this but this is because of the overshoot once you get overshoot that means the momentum in other side is going to be that strong that there might not even be a re-test of a new low i've mentioned it in my previous videos but i'm just going to mark the trades and let's talk about the trades so like i mentioned we started with the prices working lower break new low and then we're working higher and we spike
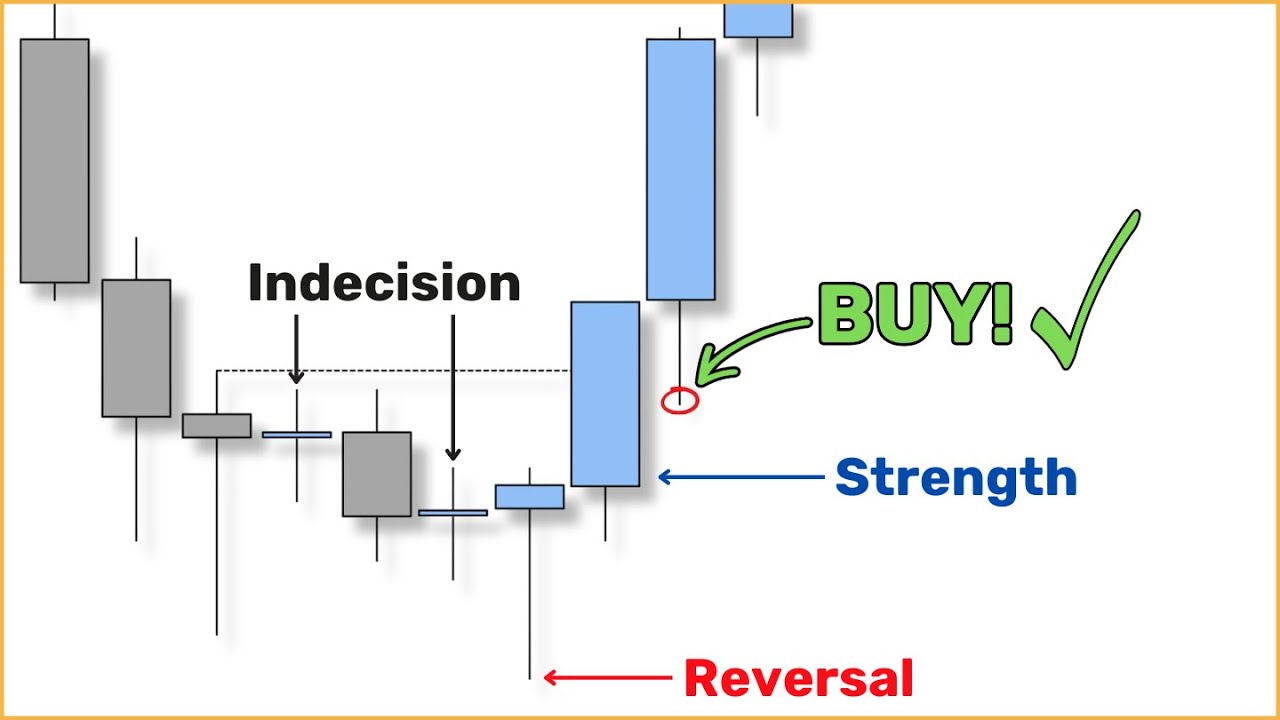
through the ema this is normally a sign of a reversal pattern so from this point on this is starting to look like a trading range day we are moving up and down up and down even though with this break and a new high i still took this trade and when i was trading the bar i actually had much bigger much better and bigger bullish reversal bar after you reload the chart you can actually you know the bars may change a little bit but i took this trade because this is a according to our rules high
probability trade this is at the key entry point this is the new low this is the new high pullback first entry pullback second entry it is at the ema we made a double bottom at the ema and we have a break and a new low of this correction working lower so i was really feeling it even though with the break of a new height this leg was fairly steep and they're most likely gonna be a second lag so this was a really good trade today because it is a key entry point finally we made a
second lag to a new high so you really want to be careful you know you really need to stop thinking long at this point and you can see prices just kind of chopped around but you don't want to short this as well this is trying to look very congestion like and you don't want to trade the smaller trading range this is a congestion smaller trading range prices broke lower through ema we shot through ema and we pull back once this bar formed now this is the time when i drew my trend line and i just
copied it lower and you can see it fits on the lows and on the highs so this is how you know the trend line is valid it fits priceless nicely and neatly nevertheless this is just the first entry from this point but once prices tried a second attempt by the balls to go higher and we got you know shut down from the trend line and from the ema this is a key entry point as well as and very high probability setup so even though the signal bar is not good i really like taking chance on
this one but uh if you if you see the signal bar like this this is not a bearish reversal bar by any means so i guess you know you can be a little bit hesitant but the key entry point is so strong that you really want to take this trade and true to its form prices break the trend line and there you now are expecting to make a new low and it happened like prices most of the time do we spike through ema quite big big time so i might i was quite thinking we might
not even retest the new low but we instantly the bears instantly you know sold the market and we just chopped below the ema and this is the first pullback below the ema i just marked it uh i didn't take this trade but i just marked it because after such a big bearish bar this is a huge you know rejection of all the bullish activity such a big bearish bar and we couldn't close above ema we didn't even close bill above ema so we are working below the ema so this is the good reason to take
it it is a perfect you know bearish pin bar so for that reason i think it's really good but now with this second entry this is a new high pullback first entry pullback second entry market always moves most of the time moves in twos this is a two-legged pullback to the ema and bulls try to go along two times and once you know this is our human behavior once something doesn't work once people always try it the second time but once it doesn't work second time we're done this is how human psychology is working and
this is why you know the second entry worked this way and this is why al brooks actually discovered the system early earlier you know 20 years ago because the human psychology never changes it you can see but now almost at the very end of 2020 the second entry is still valid nevertheless nice big bearish bar felt second entry long according to rules you want to go short here it was very tempting to take these shorts as well but at this point you have a new low and you're you know shorting the very low of this
move and this is not this is not a key entry point this is not a high probability setup we want to wait for higher probability setup as much as possible so prices you know sold off massively i didn't really expected it to happen like this but nevertheless it happened and once again we spiked through the reversal look at the idle ema didn't even put any rejection we spiked through ema and the ema serves as a stepping stepping stone sort of prices pull back and step on this ema and ema is holding this is a reversal
pattern and this serves as a set up for your trend line so you draw the trend line you put it to the other side and prices are fitting fairly neatly you can see the bitcoin from the trend line right here we have a break new high so at this point you have a break new high and a second attempt to make a new high and prices you know rejected the bullish momentum again so this is where you wouldn't be looking for shorts because this bullish correction has played out and this is the theme for the
day the shortened trend lines are keeping you on the right side of the market this is it's very tough to find some bigger pattern yeah there might be something like this looking at this now but you know i don't think this is valid because it doesn't fit from the lows that much maybe it actually fits here maybe this is the bigger pattern that i just missed during the day but uh yeah this looks actually kind of bad this gives more credence to this trade uh i'm just gonna delete this because you know it's not that
obvious to find this bigger pattern the shorter term trend lines will guide you safely during the day any market you trade so this is the new high we made this high is higher than this high and this high is higher than this high so this is the highest high of this move we're working lower first entry first attempt by the bulls to rally mark it higher and it felt it got rejected look how rejected strong it got instant spike through the ema little pullback second attempt by the balls to go higher and a second and
it failed and this is our chance to trade failed second entry long once again similar pattern here first entry second entry new high first entry second entry so this is a you know the same pattern as this repeat pattern so you want to take this bar even though the bar is not perfect you want to take the trade right here because there's a felt second entry alone and this this correction played out with the break any new high and a double top from here it's usually working lower price is pull back to ema and trend
line again but you know at this point you should have entered here at the felt second entry long and you really have to follow the rule because now even though it worked here you know you never know next time it may not work because this is just a felt third entry long and that's really not a thing you know this is not reliable setup so even though it's off to trendline i'm not a big fan of this i like only the higher probability setups and the prices work lower and here's a key moment that happened
today i took this straight and i got trapped here and i thought i outsmarted them but you know they outsmarted me here because i knew once you have a overshoot you're most likely going to have a reversal to the other side and you're most likely not going to read this in your load so with this reversal there is a big chance that we may not retest the new extreme but so once i saw this bar once i saw actually i had to change my ema color my template is not saving properly i always it always
you know goes back to yellow ema so as i apologize to you guys uh i have to you know save it properly i don't know why it keeps going back and i just you know i've been trading with yellow ema for so long that i don't even realize that it means i need to make it blue so it looks better on video nevertheless when i saw this bar i knew that i shouldn't take it even though it is from the ema and trend line i knew i shouldn't take it this is most likely trap but
look how tempting this looked first entry second entry double tap at the ema trend line is still holding second entry short and it is perfect bearish reversal pin bar so even though i knew this would happen and you know this is the mental failure on my part i knew that i was gonna go i was gonna get trapped on this bar so i you know i was strong here mentally i didn't take this bar but you know they got me here they trapped me even more they really you know this was a good bait by
the pros and unfortunately they got me here even though i knew with the overshoot i should be looking to go in you know in the other side but you know that happens in other direction so this is my loser for the day and once again you can draw the shorter turn trend line you're working higher you get a bounce from the trend line this swing served as a setup for the trend line and this you know confirm the trend line it is just a first entry but it is such a nice bullish reversal bar ema
is holding trend line is holding so i think you want to take it and it the only reason you know i want you to take this if you had better signal bar because this is a first entry pullback second entry we triggered first here above this bullet bar and then we triggered here above this bullish bar so this is a two-legged pullback to the ema in the second entry loan but the signal bar is you know horrible but if you had better signal bar you know it's according to rules and you're waiting for break and
a new high and once again it happened perfectly so this is why this is why the short term trend lines are very legit and you know if you're a beginner if you just learn to trust this because a lot of traders they don't trust this you know perfectly they are afraid you know to follow the short-term trend line because they're afraid that the bigger pattern might trap them but that's most likely not going to be the case the shorter-term trend lines are you know almost the most powerful tool as a trader you can have so
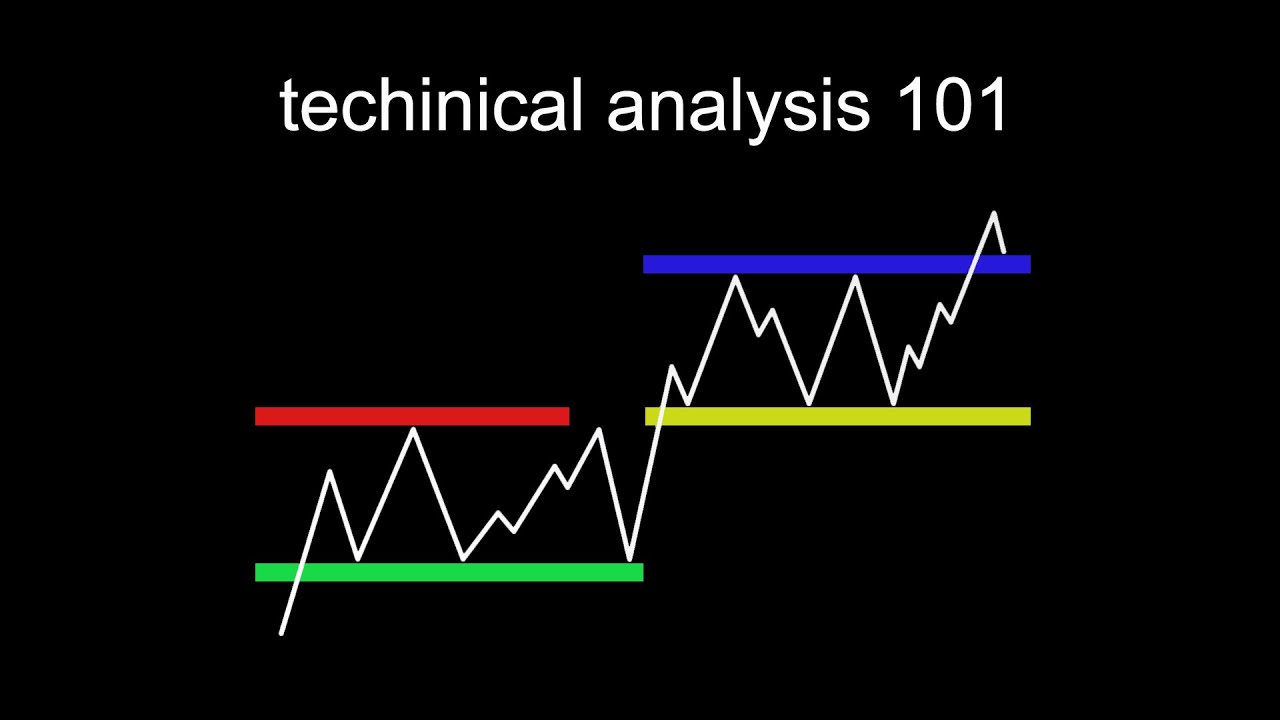
definitely follow these short-term trend lines use them as much as you can and this was the bigger picture for the day you know overall it's looking like kind of trading range day but you know not that clean you know on the bigger picture and this like i showed this channel might be valid there's some validity to it because we are bouncing from multiple sides here let me see if i can make it yeah this is even better this is even better yeah this is looking nicely nevertheless so always draw the short term trend lines i
don't forget study the chart after the after the fact so this is the way you will learn this because once you study this after the fact once you're trading in life you will get that flashback memory oh i actually saw this you know last week when i was studying my charts and you will be able to recognize it in real time you want to see the skill just like any other and takes hard work just like any other so uh hit the like button if you liked it this video if you think it was helpful
and i see you guys the next video stay safe guys bye guys