Do you know what S curve is? What's up guys, my name is Igor Felipe and today we are going to talk about what S Curve is. When we work with projects it is important to have tools to monitor their progress and so we make the comparison between what is accomplished and what was planned.
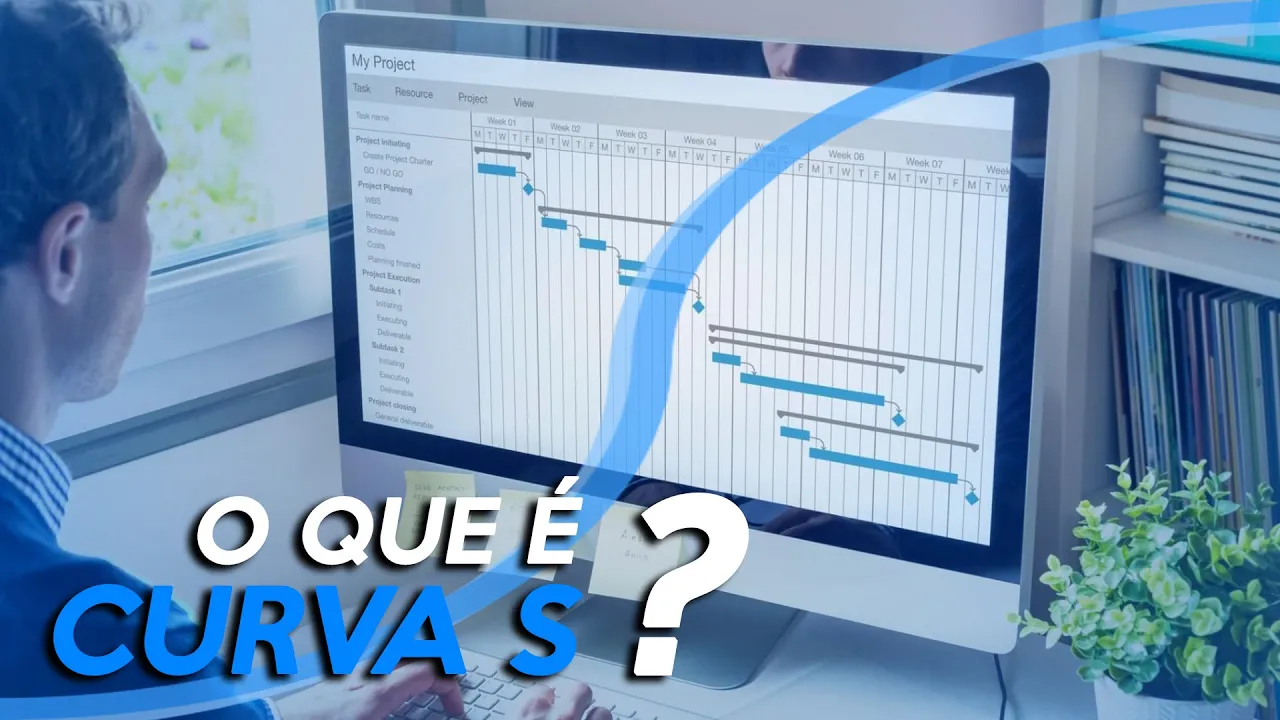
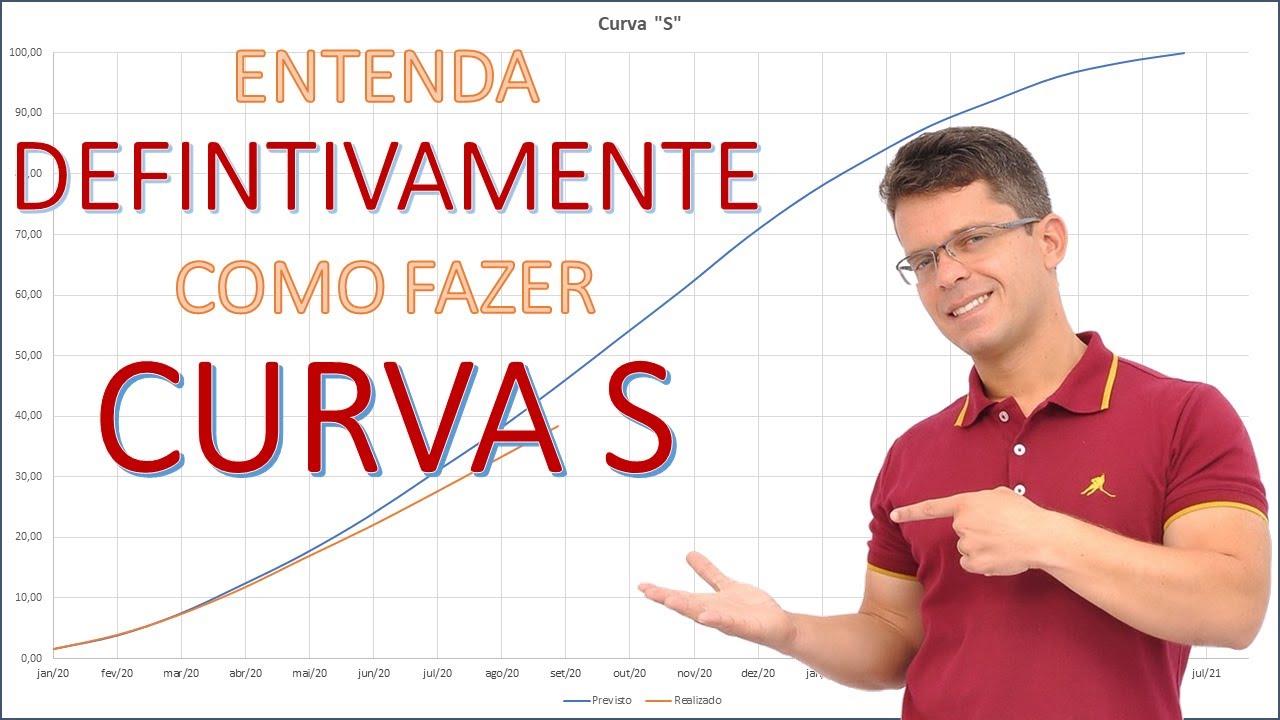
And so that we can have a better view of this progress, a tool called S curve was developed. And don't worrie, you won't need to take your project on Senna's S curve in interlagos, it is more accessible than you think S curve is a graph of cumulative values, that is, it is a graph that sums the cumulative quantity that the measure in the project. It works with two axes: the horizontal axis, where it shows the time interval and its vertical axis , where it shows the amount of service performed or to be performed, being used to show the physical or financial progress depending on the purpose of the curve.
But why is it called the S Curve? Over time it has been noticed that the amount of work done on projects is less at the beginning and also at the end of the projects. And if we think about full values, we also realize that the physical progress is small both at the beginning and at the end, and the peak service is usually a means of the project.
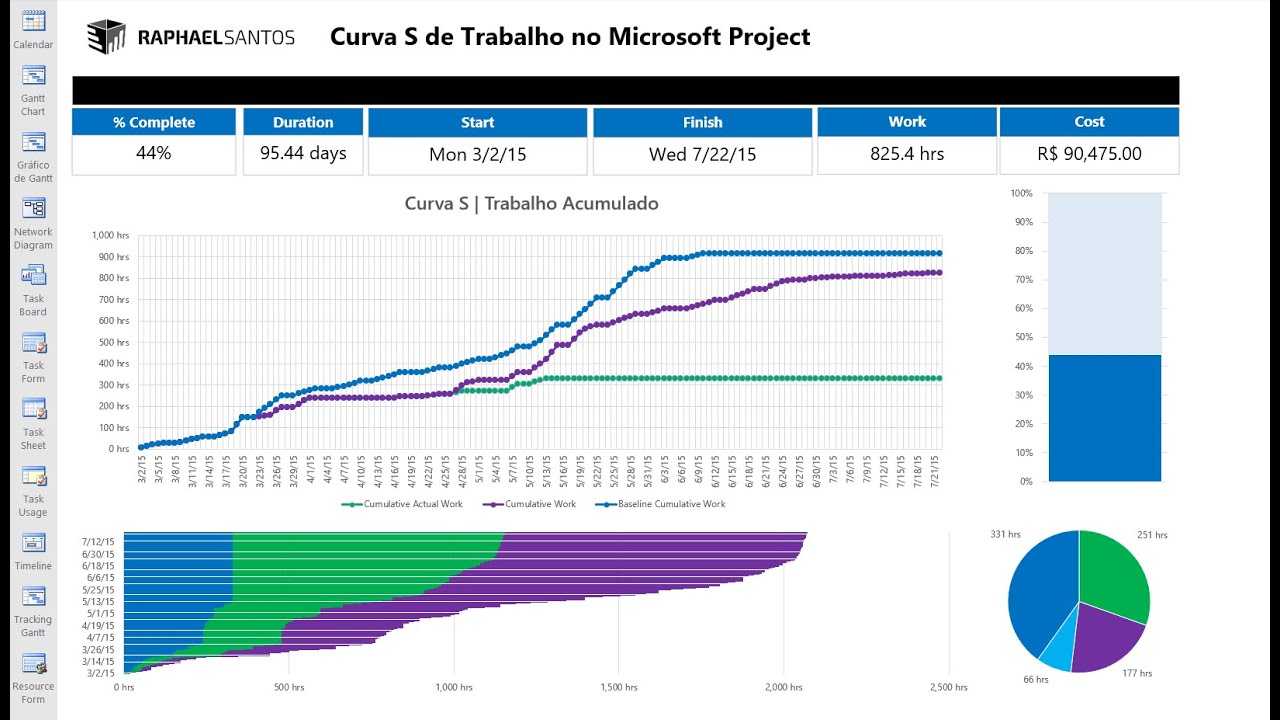
Knowing this, once you transform this information into accumulated values, you end up with a graph and it looks like the letter S. And then the name Curve S Nowadays Curve S is used a lot in project management so that it can be done monitoring what has been planned and what is being carried out. Thus, in the planning phase, an S-Curve of the project is generated so that the comparison can be made throughout its execution and a new S-Curve will be generated, serving as a parameter to know if there was a deviation between these curves.
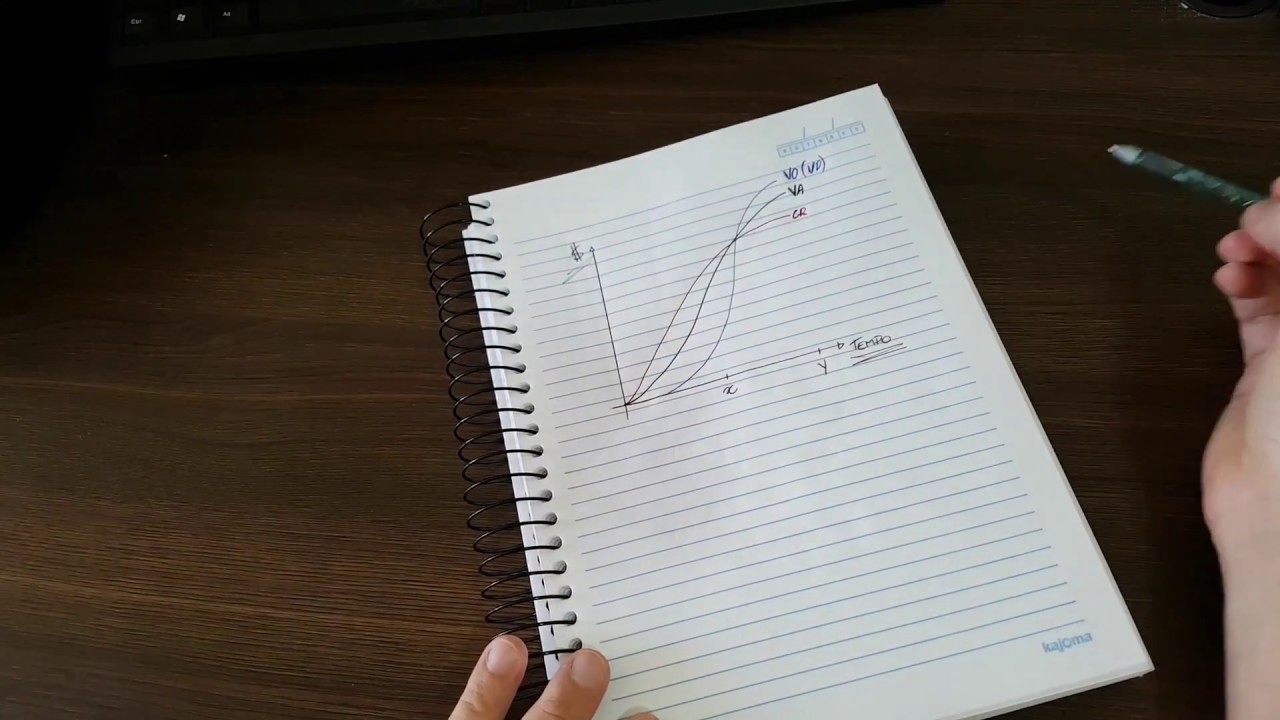
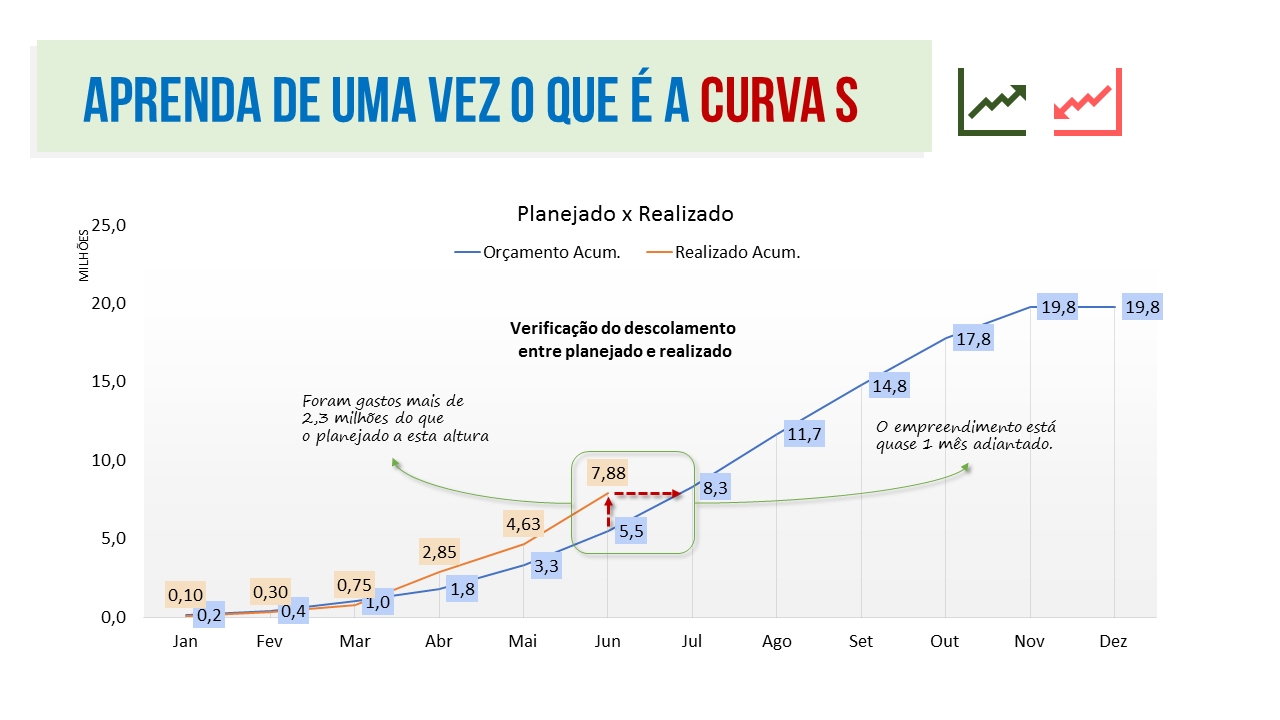
But how do we identify this deviation? Let's look at an example: Imagine that you did the planning of a project that generated an S Curve represented by the green color. As we carry out the project, we generate a new curve represented by the red color.
But we realize that the red curve is a little different from the green curve. To do deviation analysis, we establish a time value defined on the horizontal axis and compare where that time interval meets the curve. So we can analyze the percentage of the two curves and define how is the progress of our project.
And using this same type of analysis if we want to know how the execution time of our project is going, just establish the value on the vertical axis and see where it reaches our curve, thus being able to find out if our project is ahead, behind or within the set deadline If you liked to know about the S Curve and want to know new management tools leave your comment down here If you liked the video don't forget to click on like and if you are not yet subscribed to the channel click on the button to subscribe and don't forget to activate the bell so you can receive new notifications for new videos.


![Como Fazer uma CURVA ABC na Prática [ORÇAMENTO DE OBRAS]](https://img.youtube.com/vi/60VnEqcMrMI/maxresdefault.jpg)


![O que é uma Curva S e como interpretá-la [Teoria]](https://img.youtube.com/vi/t3HI5lvynqo/maxresdefault.jpg)