Hey folks, welcome to verified investing. com. My name is Gareth Soloway, chief market strategist here.
Now, in today's video, we're going to look at commodities, mainly gold and silver, which have staged some massive intraday moves. Unbelievable action that hasn't been seen in decades there as they again hit new all-time highs before a recent sell-off. We're also going to look at my favorite play for early 2026.
The first half is oil and it continues to rip. So, we're going to dive into that as well. But, let's start out with gold here.
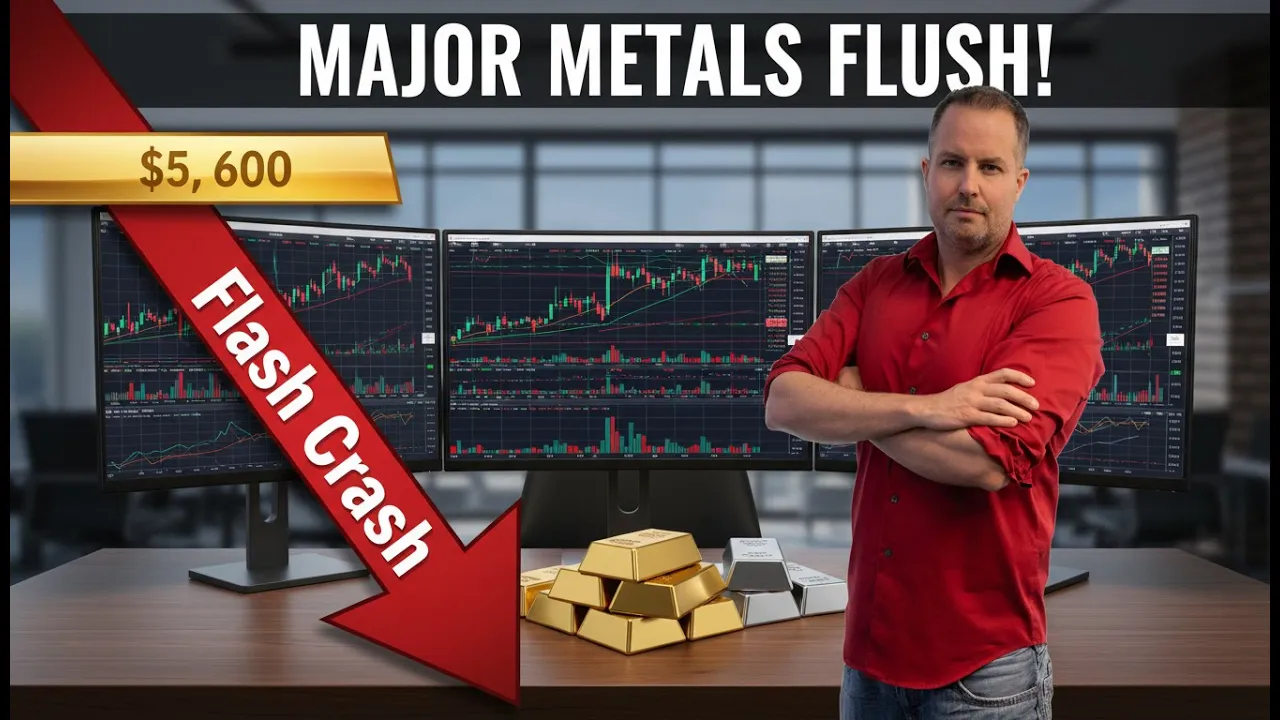
This was remarkable, folks. So, gold early in the day traded as high as 5600. It then collapsed all the way down to 5100 before stabilizing right here at 5300.
But this is a big deal. This puts in kind of one of those crazy dogee candles that again it doesn't necessarily tell you a top is in. What it tells you is that the market for gold is vulnerable right now.
Now what do I mean by vulnerable? Well, basically anytime you get some sort of big flush like that, it tells you that the liquidity or the leverage essentially within the gold trade, and we saw this in silver, has gotten too stretched. This is something if you're in cryptocurrency, you're somewhat used to where again you'll see these massive flushes because people get overleveraged and then they get blown out.
They get basically margin called on the way down and the system auto automatically liquidates them. And again, it's a signal not because it's a signal that there's there's not more demand for for gold. It tells you people were taking too much risk to get long.
They were overleveraging themsel. So, when we go back to the chart and we see this type of move, it could signal a top and we'll go over a couple factors there, but we just don't know yet. We need to see some follow-up signals here.
Now, what I want to do is just show you the intraday. I mean, look at this move. This is where silver, excuse me, gold was trading when the stock market opened, which kind of by the way is interesting because that's when the big institutions get involved, right?
And so ultimately you had uh gold trading around 55 5550 and then within these are 10-minute candles. So within one hour it fell basically 10%. That's I mean again, you know, if you're new to gold and silver, you're probably like, "Oh, this is like whatever this is.
I trade stocks, I trade meme coins, whatever. This is unusual for gold. And by the way, it's not healthy for gold either.
And it's also, and I talked about this in a previous video, the move in gold and silver is not it it it's fine that it's moving, but what it tells us about the underlying issues within the US, whether it's debt related, whether it's alienating neighbors and and allies, whether it's about the Federal Reserve, that is what is telling you there's an issue here. There's a reason why people like me, and I bought a long time ago in like 2017 to 19. I even bought earlier than that, but a majority was in 2017 to 19 in gold.
There was a reason why I was buying the metal, right? It was it was a protection. It was an insurance policy.
And now you're seeing the masses feel like it. They see the writing on the wall saying this is unsustainable. And even Jerome Pal said this yesterday, and eventually we're going to see a collapse in the currency, right, in the dollar.
Um, and that's again what we're seeing. Now listen, you're going to have corrections. You always have corrections.
And you could see very clearly that we've had we had this big move, now this type of move. Be interesting to see what happens. But this candle on the daily, I will keep an eye on.
The other thing to kind of keep an eye on here as well is what I would call a measured move. You take essentially this first move up, right? We take that measurement and then we take that from the breakout and we map it.
So essentially what you're doing is you're putting a flat line to right here, right? So, we'll take it that and then we drag that and we match it up. And this was essentially this move once we broke out replicates here.
Now, we did go a little bit higher, but it's still within that range. And again, that's a simple what we would call in technical analysis a measured move. All right, moving on to silver.
Let's take a look at silver here, folks. And silver. Now, this is interesting because we still have this topping tail in place.
So, again, a topping tail is a candle where heavy volume comes in. It has to be at the highs of the chart at that time at least basically going back six months which it is obviously this is all-time highs. In addition, what it needs to do is it needs to have a long tail on top which tells you sellers come in and it must close in the lower 25% of the entire candle length.
That's what this did. Now, if you look at today's price action, we were above that. And if you close above it, so basically any daily close on silver above that high that negates the topping tail.
Now in this scenario earlier today we were above but look we've now come back below that on silver which means that the dominance of this candlestick is still fully intact. And that's something we have to pay attention to as well because again that's telling us that if we don't take that out that this still has a bearish vibe to it. And again, by no means am I a bear long-term on gold and silver, right?
I listen, I own a ton of gold and silver, a ton of gold and silver. But again, I'm also a trader near-term and I look at the charts. This could be a chart of Apple.
This could be a chart of Bitcoin. It could be a chart of anything. And the charts are what tell me ultimately what to do.
Now, can charts fail? Absolutely. In fact, I've seen signals of tops and silver many times before um recently over the last couple weeks and they've so far been negated.
So far, this one hasn't, which has to keep us on our toes because at one point, one of these will absolutely play out to a pullback of 20, 30, 40% on silver. I still think we're probably headed back to about $75 at minimum, maybe even more depending on what happens. Now, the other thing to keep an eye on here is that the stock market sold today heavily and Bitcoin, excuse me, and well, Bitcoin did sell today, too, but gold and silver sold as well.
And so, what that tells us is that right now, gold and silver are being used as risk assets because the gains are so good. Now, if you're like me and you've been in gold for 10, 15 years, well, what we know is that gold is actually a hedge. A hedge against inflation, a hedge against other things.
But it is interesting to see that right now it's being traded more treated more like a risk asset. Now let's go to oil real quick here guys because this again is important to take a look at. This was my favorite play coming into 2026 right down here for the first half and so far it it isn't leading but it's had a great move but I talked about how money would rotate in here.
I talked about how again if you look at oil as an inflationadjusted asset it's lagging massively. Just like don't even assume like let's just say oil is the same place. It's trading at the same dollar value as literally 10 years ago, 15 years ago.
But if you see how much inflation's in the system since that, since in the last 10 or 15 years, it honestly should be trading at $100 a barrel. Now, I'm not saying it's going to $100 because there's more supply out there, but I do think it's headed towards about $80 a barrel. And again, this is going to be interesting as well because of the inflation implications.
So, if you look at copper, right, if we go back to charts and we look at copper, let's look at a few of these, right? Look at copper today. New all-time high.
Now, it's getting battened back down off of this level, which is still technical resistance. But this is, I mean, in talk about inflation, you have oil up 15% since January started. You have copper, which is up, you know, if you go back here, copper is up probably about 15% as well.
You have silver, which is up even more. You have palladium. You have platinum.
I mean, there is inflation. There is no doubt there is inflation. I even show the charts of LE which is live cattle prices.
So this is when Trump made that deal with Brazil for for cattle and and basically to get meat prices down. And look, it's gone right back up. Now we're not at alltime highs, but look at the run here since the beginning of the year.
Again, we are up significantly about 10% on cattle prices. This is all going to translate. And I didn't mean this video to start to get into inflation and macro, but what we have to recognize is listen, whether the numbers are faked or not, we'll find out.
But there are definitive signals of inflation in the system here. And if I if we don't see the January CPI number and PPI number uptick in February when they're reported, I'm going to have a real major issue with that overall in terms of what we're I mean, we're very Listen, you can't hide the numbers of these commodities. They are going up.
Now, listen, wheat is down. Yeah, sure. Weed, corn.
I mean, those have been down for a long time, but even even wheat is actually starting to uptick. And this is one of my favorite commodities out there. And again, I didn't mean this to be an overall commodity um one, but take a look at this, guys.
Look at this on wheat. It's trying to break out. Now, listen, in the scheme of things, is it way down?
Yeah, but look, since the end of basically since the beginning of January, where's the beginning of January? Right here. Look at this.
What's weed up? Let's go take a look at this, right? 7% just like that in less than a month.






![EMERGENCY Palantir Stock Update [Do This ASAP]](https://img.youtube.com/vi/v2d3yRV_h6o/mqdefault.jpg)