foreign folks welcome back to lesson three for the August 2017 ICT mentorship content this is short-term top-down analysis and it's daily to four hour okay before I begin just remind you that of all the concepts I've taught you all the varying possibilities that you can use the information this is my specific approach to it so know that going in the this is not to impress upon you that you only can do it this way it's this is how I use the information I've gone through all this information myself over the last 20 plus years and
this is my personal approach to doing so so as my trading plan if you will this is it this is how I operate and I've used everything I've done in the monthly and weekly presentation the two lessons before this one that is all the work I do I don't do anything additional to that once I arrive at my high time frame bias relative to those first two teachings what you're about to see here is all I do and these next two lessons this one and the following one after this for intraday top down I don't
want you to Breeze through it expecting some magic uh picture or magic formula okay it's this my unique approach to doing it using all the information I'm not applying every possible scenario I'm looking for conditions I'm looking for a stage then I'm looking to execute in that stage so in other words I'm looking for a condition or bias long term I'm looking for a stage or a setup that I look for all the time that doesn't deviate doesn't move all around doesn't change him morph one day I'm doing this and one day I'm doing that
and then once I know that then I go into a lower time frame and I execute with that similar pattern in mind so everything is fractal so again please don't take this information that you have to only do it this way it's just meant to provide you what I promised this is exactly how I interpret price and how I am able to call the markets when I'm accurate this is how I'm doing it now I'm always uh unsure just like anybody else about what the outcome is going to be and you've been with me for
more than 12 months on a daily daily basis now and if I force myself to be every single trading day you know in front of the charts with you or by myself even I'm not accurate I have to be selective on what I'm looking for and hopefully you've learned actually at the end of all this teaching that there's a specific time window that you want to be focusing on trading and speculating only in that window of opportunity not trying to do every single trading day that's what retail does and smart money doesn't do that just
look at a long-term time frame and you'll see that they're not always in their busybodying taking the trades every single day they're waiting for specific setups conditions and levels that they already determined and arrived at for fair value all right so the focus of this presentation is to determine the impact of the daily perspective on a given asset or Market identify the directional bias for the higher time frame daily chart classify the PD arrays accurately to assist in key levels and complete an Institutional analysis on a daily basis okay so once I go into the
daily time frame the first thing I'm starting to concern myself is what's the smart money doing and because all the assets that I trade they all can be looked upon in the form of cot whether on trading the s p which I no longer do anymore but you've learned about it this mentorship you can pull up the cot data and pull up the last 12 months and look at their highest high in this lowest low in terms of their net holding position and we can get a depiction of whether they're hedging buying and selling and
that's more of an intermittent short-term basis on using CO2 data so I start my perspective from the daily time frame zoning in on what the commercial Traders are doing to large commercial hedgers for the market on trading so if it's the bond market I'm gonna be looking at the cot data for the 30-year treasury bond and I'm going to get the highest high and the lowest low in terms of the range of their net position now it may be a time when it's above the zero line like everyone else usually uses that CO2 graph it
doesn't make a difference to me I create my own zero line by getting the 12 month high and low the highest high and the lowest low of their net positions and divide that in half that gives me my new range and above it it's bullish and below it is bearish now again before we go any further it's important that all monthly and weekly analysis is carried over into the daily time frame that's what lends us to believe there's going to be a bullish or bearish bias preferably the daily should confirm it next thing I look
at is open interest and again if I'm looking at the s p or if I'm looking at the bond market or currencies for 4X I'm going to go back to the original contract traded in the currency Futures Contract I'm going to refer to the open interest I want the insights cleaned by open interest to either support or negate my trade the next thing I consider is institutional order flow on a daily time frame so I want to know what the institutions are doing am I seeing sponsorship and price action if I'm not it's probably going
to be a low probability setup or I'm probably going to lose money I'll take the trade so ideally I want to see institutional sponsorship behind price action and it's seen by institutional order flow the next thing I do is I want to try to determine what weekly profile is most likely going to unfold and I use the economic calendar the heart start framing this and if I can't arrive at that I go with my best assumptions and if I'm wrong I refer to the economic calendar later in the week to correct my assumptions and there
may be a weekly profile that works the later half of the week versus the Monday Tuesday Wednesday phenomena that I like to work for for one shot one kill okay then I'll start looking for intermarket analysis and I'll start looking at the relationships to correlated pairs or correlated assets so I'm looking for smt diversions uh dollar making higher high Euro failing make a lower low that type of thing um in in the daily going into the four hour now it starts to mean something and you can get really Dynamic uh confirmations to trade ideas by
starting to use smt from the daily down into the four hour next thing I'm looking for Market structure and now we're going to start incorporate you know a heavier use of Breakers and mitigation blocks and I'm going to be looking at overall bullish Market structures and bearish Market structures and maintaining that overall institutional order flow while we're creating a larger degree of Market structure swings and I'll be looking at the PD array Matrix again defining the PD arrays from premium to discount using those levels I'm going to calibrate to get my key price levels I'd
look for a trade setup or entry and by doing so I end up a with a daily bias so at this point my daily bias is defined so going through all these steps leads me to whether I'm going to be a buyer or seller and going through this yourself you'll see that it's going to put you in sync with the most likely large price range expansion you're not going to get every move every single day isn't going to be up when it's bullish and every single day it's going to be down when it's bearish but
we're focusing on where time and price meet when economic drivers come out it helps form that Weekly profile that we're expecting it may be a Monday low of the week or it may be a Tuesday classic low of the week or it could be a Wednesday low of the week where Tuesday fall short of a buy level we were waiting for but starts to rally and trips us up and then trades lower again into Wednesday and creating a lower low and that becomes the low of the week when it's bullish so there's a lot of
things that you have to weigh out and once we arrive at all these components we will will eventually lead to a specific daily bias and it'll be defined from that higher time frame banking time frame where the bank's been spend most time looking at it's the daily chart so you want to transpose all these ideas and Analysis and levels over to our four hour chart okay so again I'll begin with the commercial hedging so in the process of developing an opinion of smart money and they're in their respective actions in the market I refer to
the last 12 months of the commercial hedgers commitment of Traders net Holdings or if that range is very narrow or it can't discern from looking at 12 months I'll go down to six months and it'll give me a quarterly to quarterly effect where I can see the other range they are working with them but usually I'm going to adopt the 12-month range so whatever today is I go back 12 months from that day and it's always wherever you're looking at the price right now go back 12 months and you get a dynamic perspective on where
they're at in terms of their hedging now what I do is I determine the highest and the lowest readings in the cot line chart for the commercials not anything else but this commercial is not the large speculators just the commercial hedgers and then I visually divide that range in half now I consider the net position bullish if above halfway mark of the 12-month range and bearish if we're below the halfway mark of the 12-month range so if I'm below it I'm going to be focusing on discount arrays and looking for scenarios where the market should
expand to the upside reaching for some measure of a premium the next thing I do is I look for open interest now prior to getting to the Daily I'm not really concerned about it when we can start looking at it in the weekly and I used to do that when I was younger and get really obsessed about it but really until I get down to the Daily I'm not really concerned about open interest so once my analysis takes me into that time frame I consider the use of it so I want to see open interest
decline about 15 or more when price is trading at a higher time frame discount array this is extremely bullish especially when the monthly weekly or bullish as well I want to see open interest increase about 15 or more when price is trading at a higher time frame premium array and if this occurs this is extremely bearish more so if the monthly and weekly are calling for lower prices as well now in between either of the above conditions for my personal Style Trading open interest is not considered in my analysis so it either has to meet
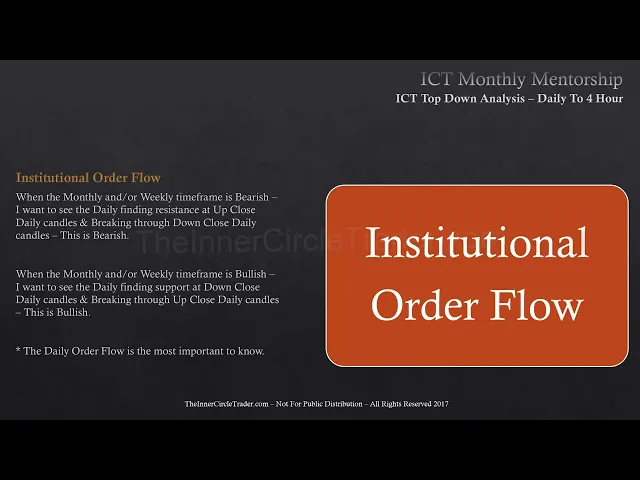
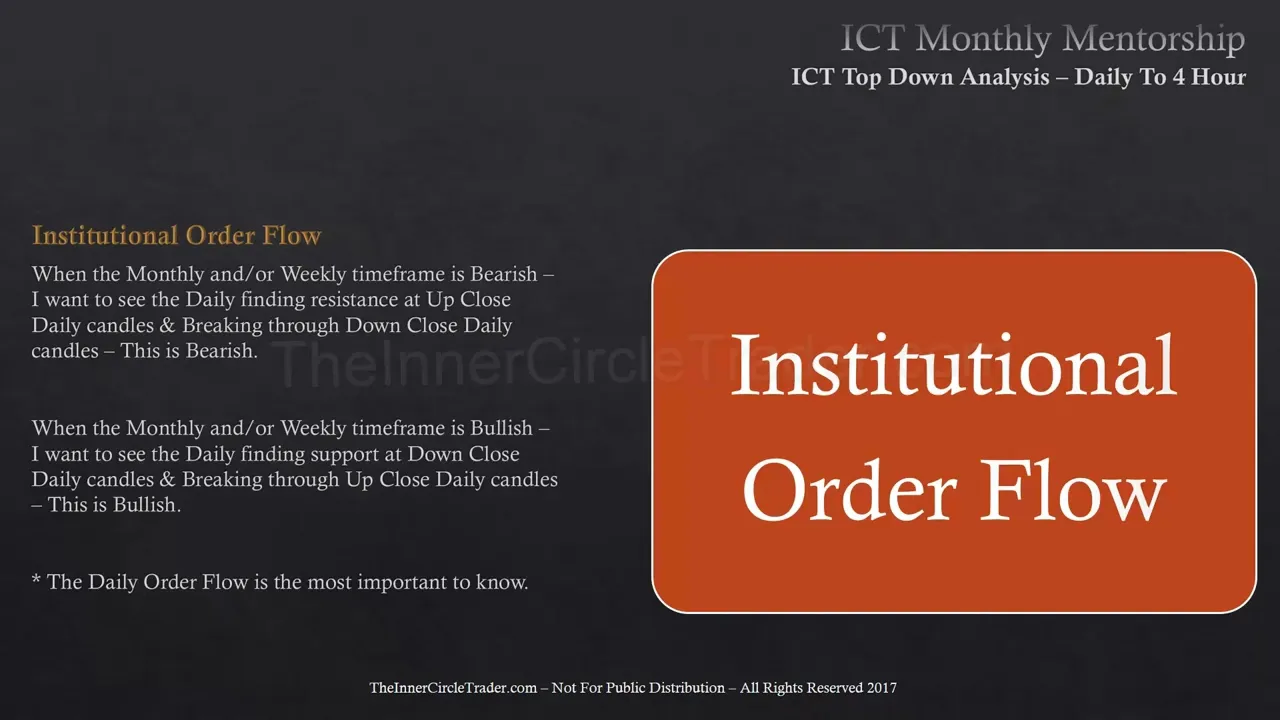
one of these two criterias or I'm not going to refer to it at all okay institutional order flow now in the monthly and or weekly time frame is bearish I want to see the daily finding resistance of up close candles on The Daily and breaking through down closed candles on The Daily this is extremely embarrassed that's going to show us institutions are in control on the sell side or the buy side relative to those conditions when the monthly and or weekly time frame is bullish I want to see the daily finding support at down close
daily candles and breaking through up close daily candles this is extremely bullish the daily order flow is the most important one to know if you don't look at any other time frame and you just simply want to disregard weekly and monthly not to I would advise doing that but I know a lot of you just for whatever reason don't want to look at these higher time frame charts but if you do not look at them or refer to them at least study them from an Institutional standpoint you're really shortchanging yourself in your analysis and creates
too myopic of a view but you have to at least start on the daily if you're not going to go any higher at least start all of your analysis on a daily chart because if you don't know what the daily charts implying in terms of institutional polish or bearish okay you're playing with uh you know Russian Roulette you don't know really what's going to happen on the lower time frames and what may look like bullishness on a four hour one hour less may actually just be a setup that gets you short from a daily perspective
so it's very important that we follow what the institutions are doing from a daily chart and hopefully the monthly and we clear an agreement weekly profile when the monthly weekly or just the daily time frame if I can't get a clue as to what monthly weeks they're doing maybe they're in consolidation maybe they're neutral maybe they're conflicted okay maybe the monthly is expecting uh lower and weekly is not doing anything that would indicate a continuation of that or hasn't retraced enough to get in suit with it so again starting with just a daily time frame
if it's calling for a bearish market I start looking for scenarios that might produce specific bearish weekly profiles now in the monthly and weekly are just or just a daily time frame suggests the market is bullish I start looking for scenarios that might produce specific bullish weekly profiles now keep in mind the weekly range typically forms between Tuesday and Thursday that's the bulk of the weekly range there could be a low that forms on Monday and it could dilly dally around on Tuesday and then take off going through the second portion of Tuesday all of
Wednesday in the first half of Thursday creating a highly week and then Friday could be just retracement that's how I internalize the weekly range when it's bullish when it's bearish I internalized the Tuesday creating the high of the week and Thursdays New York open creating the low of the week and Friday and Monday being just consolidation portions or near the open of a power three type scenario and Friday being enclosed for power three for the weekly range isn't always the case but that's how I adopt all of my bear scenarios and I start there I
start looking for the weekly profiles to fit that way unfortunately only asset to us in terms of forecasting weekly profiles is the calendar so using the calendar and looking for specific drivers it's going to assist you but there's no cookie cutter one fits all approach here you can't do it where it only does it this way and can't do it another way if it was believe me I would love to show you and I would be able to show it off and be on the internet every day doing it but I can't okay so the
limitation is we can only do the analysis during the weekend before the market starts and then on Sunday see where we open and then watch what trades on Monday so that's why I like to sit on my hands usually in the mentorship I've been active in Mondays sometimes or watching the market more closely than I would normally if I was just trading my own money and not being in front of anyone but I like to see what Monday does I'm willing to give up that Monday low of the week because if it's going to go
higher generally Tuesday is going to give me an optimal trade entry based on Monday's low and then I can get in if not Wednesday we'll do it off of Tuesday's low so I'm not really concerned about getting the lowest low I just want to get in the meat of that Tuesday to Thursday portion so that's that's like the bulk of what I'm aiming for and if I can get Tuesday's action into Thursday's New York open then I got it that's all I'm looking for and it all doesn't always unfold like that obviously but for more
on weekly profiles I'm going to cancel you to go back to March's content for details about what weekly profiles exist and by looking at the economic calendar and I give you the details in there which Market profile for the weekly profile rather would unfold or likely unfold you use the economic calendar and the institutional order flow from the monthly and the weekly and now this daily stuff to get in sync with what may unfold for a weekly profile and again you're never going to dial in and get it accurately every single week it doesn't it
doesn't work like that but if we can get very close to what may unfold and focus around the economic calendars drivers for liquidity runs all those manipulations that we can get in sync with that we can anticipate a specific type of phenomenon occur and as long as it's in sync with our higher time frame condition or bearish or bullish bias the setups are staged for our entries will be a lot easier to anticipate using the economic calendar and forecasting the weekly profile don't expect Precision to that degree I don't know how to get weekly profiles
called every single week I have a rough idea what may unfold relative to what the economic calendar is so on the weekend before the market even opens up you see me do usually one day at a time the morning of or the day of our analysis you don't want to do that you want to start in the weekend like today at the time of this recording it's a Saturday so what I would like to sit down and do is look at the economic calendar for the entire week and see where the drivers are for the
week in terms of what session whether it be London or New York and what day of the week and see what type of phenomenon May unfold relative to the premium raise and discount arrays that's in the marketplace right now if I'm bearish and I think that there's going to be a slow start to the week because the economic calendar is rather quiet until around Tuesday New York open well guess what we may end up seeing a market reversal in the New York open that particular day and starts the weekly range so it's a lot of
scenarios that you have to play around with and I don't have and I've never been able to create a systematic approach for forecasting weekly profiles I just know once the week starts and I got usually Monday behind me I got about a 60 likelihood that I'll be able to determine if I have the higher time frame right what the weekly profile is going to be the it increases if I'm wrong on Tuesday because then I know pretty much it goes into 70 likelihood and 70 with Wednesday Thursday and Friday's uh trading left in the week
I can usually find something before the Friday explodes it may not be the whole once that one kill I was looking for but I can do a day trade or I can scalp the rest of the weekly range and get you know whatever I'm looking for for a weekly objective but the main thing I like to uh focus in on is that Weekly opening the weekly opening price on Sunday I start there but I also look at the midnight opening price on Monday and I take that Monday midnight open and I take that opening price
and I'll take it across the entire weekly every day all throughout the entire week I'm looking at what we're doing relative to the opening price Monday midnight New York time so I'm disregarding the entire first portion of the trading that starts on Sunday and I'm looking exactly when Monday begins in the states the U.S at midnight that opening price I use that also for power three as well so I use Sunday's opening price that's our natural opening to 4X and or I use the Monday opening price at midnight so the opening price at midnight Monday
New York time I use that for a weekly opening price as well and I want to see what price does across the week relative to that opening price so I have two opening prices that I'm looking at for the weekly profile a weekly range the standard natural Sunday's opening price and then I have midnight opening on Monday so it's midnight in Monday morning in New York time as soon as that price is printed I take that and I see if we can trade above it or below it for the weekly range and honestly look for
the same thing for the Sunday so Sunday's opening or Monday midnight opening price New York time I want to see if I'm bullish preferably I want to see price go down below those prices and seek some kind of a discount array or if I'm bearish relative to higher time frame monthly and weekly if I'm expecting lower prices I want to see price trade up above both of those prices or at least one of them that makes sense in terms of discount to Premium so if it gets up to a premium array above that opening price
relative to some of these natural opening or midnight in New York Monday morning whatever that opening price is printed then the easiest way to do it is get an hourly chart open and whatever the opening price is on the hourly at midnight Monday for whatever pair or Market you're looking at that's the opening price I use for the weekly okay and then I look for smt Divergence and I start using intermarket analysis as I explained in previous uh first two lessons here for this month but I'm really specifically looking for smt diversions to confirm an
opinion I have on price now if I'm bullish obviously uh the cable and I want to be seeing either a higher low when the dollar makes a higher high or I want to see a failed higher high in a dollar when the cable has made a lower load that could be a liquidity run for cell stops and then a turtle soup long so I'm looking for smt diversions at this point from daily young into four hour because I think that's where the heart of its Effectiveness exists okay then I Define the current market structure again
like I've mentioned in the first two lessons but I'm looking for Breakers on a daily time frame more than any other because knowing this and where they exist in price action on a daily they can alert you to where the next intermediate term price Wing is going to form so if you go through price action and you look at how price trades from bullish breaker to bearish breaker there's a lot of movement generally between those two reference points it's the meet in the middle that's where the the bulk of the trading opportunities exist you don't
have to get the highest high right before bearish breaker forms you may not get to those types of trades right now but focus in on the daily bullish and bearish Breakers and trade in between those two price points and what you'll end up seeing is it's very easy to find setups in that because it's directly based it's slanted on one side of the marketplace it's usually one-way flows and it's easy to wait for power three scenarios like when you're bearish look for the open the rally up for Judah swings sell short and London and expansion
down into New York into London close reverse if it's been trading off of a bullish breaker on The Daily and we can start seeing that the daily time frame see an open trade down in London for a judo swing and then rally up going into New York close or or London clothes for the day so it gives us a lot of context if you operate just in those parameters now obviously there's a lot of other trades you can take but for training wheels purposes only if you start there looking at your conditions like that you'll
see that you're trading many times in the right side of the institutional order flow then I go through the daily and work my way through the four hour doing the PD array Matrix note all the discount and premium arrays and again not every single array is going to exist you may not get a fair value Gap or liquidity void there may not be a mitigation block but the ones that are there you highlight them okay because when price meets that and also we start looking at other things in the next lesson for deviations you get
a Confluence of different things that you can take trades on but we have to know what the premium and discount arrays are otherwise you're not going to be able to calibrate your key levels for where the trades actually reach for for entry or exits and then finally obviously if we've already gone through the work of doing a pdra matrix knowing what's above us in terms of where price May reach and what's below us in terms of where price May reach we calibrate those levels to the nearest 10 or nearest five level and I've already went
through this slide many times already into previous teachings so I'm not going to deliver you with it the longest short of it is is you want to calibrate those levels around the PD arrays in terms of premium and discount now you're going to end with will arrive at your daily bias I get questioned a lot how do you know what the daily bias is going to be I think what the natural assumption is when I say the daily bias when I know what the daily bias is based on my analysis everyone especially those that are
outside our mentorship group they assume that if I'm bullish I'm buying every single day and that's where retail thinking comes in if we're bullish on a market doesn't mean that we buy every single day it has to come to some measure of a discount array at a specific time of day it has to do this many times with the manipulation aspect by the economic calendar it doesn't need to but it's usually better if it does so so now if we have Blended all the elements that we've learned so far up to this point all the
way through the mentorship to now okay you will know how to find and determine the daily bias and again just because we're bullish doesn't mean we're buying every day and just because we're bearish we don't sell every day it we are still waiting for conditions to meet that expectation if we're bullish we're waiting for Discount arrays to be traded to and then execution we go along when we're bearish we wait for premium arrays to be tagged during a specific time of the day so we have time and price meeting and when it happens boom We
execute so after referring to commercial hedging considerations and referring to open interest determining institutional order flow on The Daily going into the four hour anticipating specific weekly profiles and again I'm going to count you to go back to March's content because it helps you arrive at what those profiles specifically are because there's so many variables I could literally make this volume or this introduction to moving daily into the four hour I can make a six to seven hour video and it would inundate you with more information that's really necessary because all of this has to
be learned by you going in and looking for it but use the information I provided in the March content where I taught weekly profiles and you'll know what the parameters are based on all the things you've learned so far confirm the analysis with Market correlation and intermarket Analysis specifically looking for smt Divergence now selecting a portion of Market structure to frame a trade-in so I'm looking at where we are in terms of the range and I defined a PD arrays inside that range to arrive at key levels and once I've done this what I have
ultimately arrived at is a directional based analysis on a daily time frame and then I take that and I transpose that to the four hour chart so now I have not provided you any charts I've not given you any kind of hand holding here and the reason why and I've said this from the beginning the PDFs are not going to do anything for anyone that hasn't gone through every single month of the content you got to go through each individual study you got to go through each individual presentation and learn and study it now I
already know what's going to happen so right now if I were not to continue and give you the next lesson and I said okay here's the here's the thread in our Forum start asking me questions for things that you're stuck on you're going to ask me can you have a one-on-one session with me can you help me do this I'm still unsure about this and I'm going to show you the reason why you're doing that is because you want me to take you by the hand and literally take you to the point of understanding what
I can't do without you doing all this type of analysis religiously that's the only way you're going to get it and that's why it's expensive it takes time now in the next lesson I'm actually going to give you my pet trading patterns this is exactly what I trade I don't do anything else there's a lot of other ways to trade but I'm going to tell you exactly what I do when I trade with my money when I trade with the analysis behind me all those ideas okay that I use when I do um detailed analysis
when I think it's going to be a really strong run if I say this is going to be a low resistance liquidity run or if I say this is a high probability condition or setup that's not an invitation for you to put money into it that's not an invitation for you to mimic or copy me but it is a condition where I have arrived at the highest level of an opinion based on what I've done in terms of my analysis and I still could be very wrong and you've seen me do that because I've been
with you every single day and I've used the expression the low resistance liquidity run and I think two or three of them have not panned out and that's fine that's absolutely fine because it's going to happen to you as well you're going to read it wrong or the market is simply not going to perform like you expected or it's going to do nothing okay so there's there's always a green on the roulette table we can be betting on black and red comes up or you know we can put red and black on and green comes
up and there's no way around getting it okay you're gonna get you're gonna get a loss somewhere and don't be fearful of it long and short use these ideas to come down from a top down using all the information I taught you specifically because every one of these things I've taught in mentorship in Greater detail with more specifics behind it if you do not watch the videos that accompanying the live sessions and start blending in some of the things I tuck in in terms of commentary because I already know what's going to happen this is
some goober is going to try to play Robin Hood and make this content available to somebody else or or the public and I'll do everything I can to find out who you are but I have to create the content with that in mind so it requires a lot of work on your part still because a PDF file you shared like this could it be helpful to somebody yeah a little bit but you're not going to know everything by going through it because there's a lot of things that you need to understand that are conceptually explained
in previous teachings a lot of it's inside the commentary during live sessions a lot of you just had an epiphany about market profiles a lot of you had a discovery about Market maker buy profiles and cell profiles just the weakness this past week we've done live sessions in I've got about 30 different emails from people that said I understand how to find market maker buy profiles now it made it it clicked me I finally got it and I haven't really said anything new it's just because you've gone through all the mentorship teachings and now you're
employing the PD arrays because that's what I told you that's the missing element the thing that nobody understands how to use with the ICT Concepts and in the free tutorials and stuff it's the PD array Matrix where we are in terms of that premium and discount array and which levels are going to be there because remember look at everybody asks the same questions which order block do I buy which one am I looking at all that's answered with the PD array Matrix you have to work from the entire time frame down and in this time
frame on The Daily now we're getting to the meat of what the Market's most likely going to do because we have two higher time frames above us it's going to either support and push price or it's going to change directions and we'll see that directional change on The Daily and four hour so until the next lesson I wish you good luck and good Trading