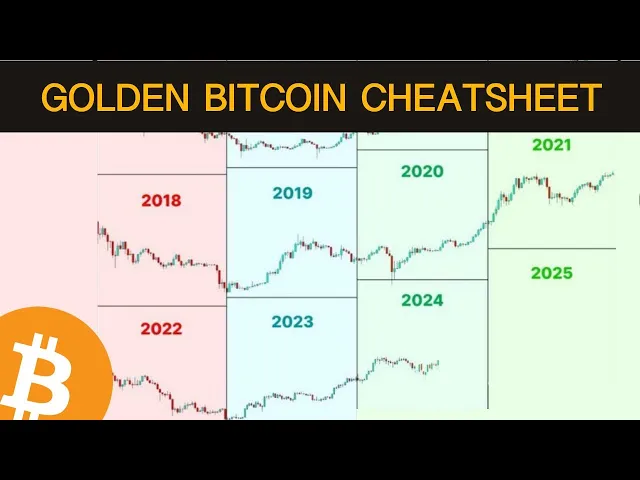
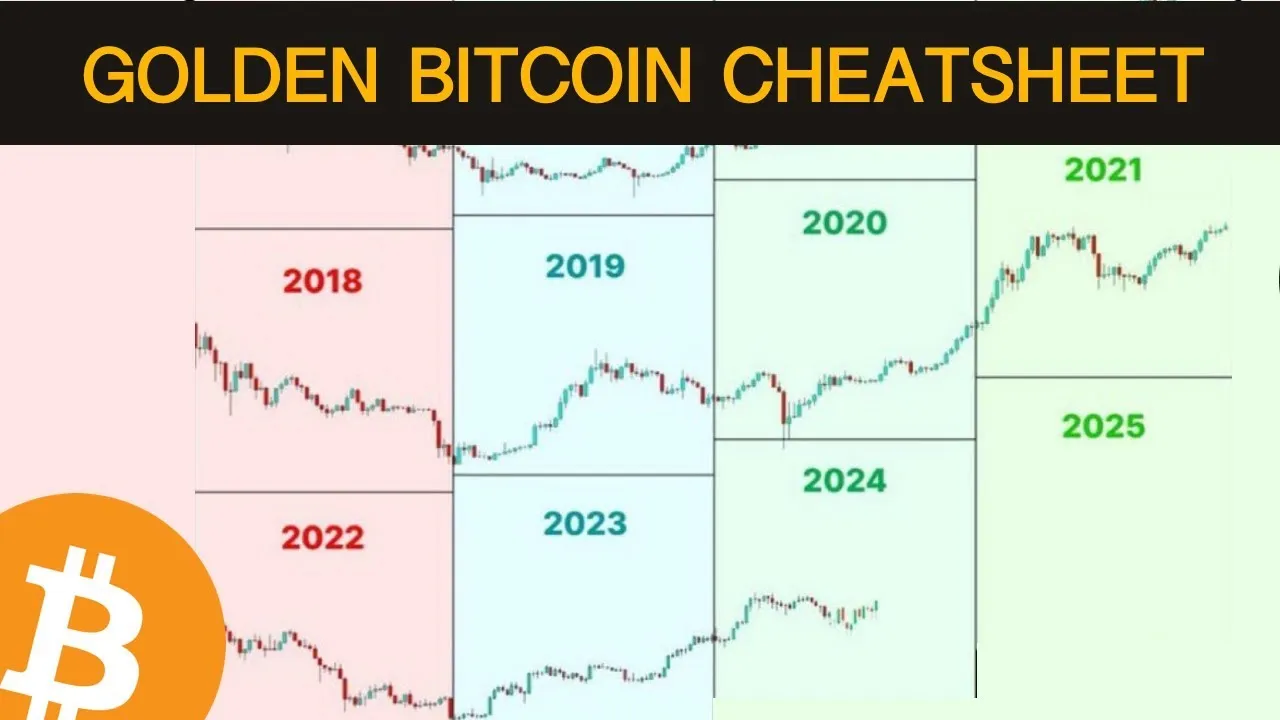
in today's video we're going to focus on the ultimate cheat sheet that you can use to your advantage in this Bitcoin cycle and we're going to be comparing all the previous other Cycles in bitcoin's price history to better understand what sort of road map we have ahead of us so subscribe to the channel for more videos like this in the future like this video if you enjoy content like this going forward and let's dive right into it so right over here we have a accumulation period and this accumulation period is something we tend to see
across time and it's the accumulation period that tends to preedee a bull market phase in the Bitcoin Market cycle and this is exactly where we are right now so just to give you some context as to where we are in the cycle right now this right over here this accumulation this graphic this graphic actually isn't up to date and it's actually not my graphic it's something I found on Twitter but this graphic isn't up to date and I'll show you where exactly this graphic considers price action in actually my chart here so so this graphic
right over here ends right over in this reaccumulation period and we've since had two accumulation periods in fact we've had one of the largest reaccumulation structures and periods in this cycle of around 200 days before we've transitioned into the post Haring parabolic upside phase of the cycle and these reaccumulation periods tend to occur for 150 160 as is the case here 163 days here and 205 days here and they then transition price into the parabolic phase of the cycle so with that little di regression here we're probably we're only in week three We've Only Just
Begun week three in the ball phase here and that's probably one of the most exciting things about bitcoin's current price action is that we are in the bull phase the parabolic phase of the cycle we're beginning week three right now and typically this ball phase can last uh decent amount of time quite a long time it can be up to a year and even worst case scenario if we see this phase play out over less less than a year so 300 days or so that still means that we have 300 days pretty much left in
this cycle and we tend to see Bitcoin cycle through its phases onee bare market and then we go into an accumulation period which then transitions price into the bull market phase always a one-year bare Market period it's always 360 days or so in this cycle we saw maybe 390 days at maximum but it's always a year long this bare cycle and then this accumulation period this can last actually a year and a half where we just move sideways and around the Haring we also tend to move sideways here as well so this probably factors in
the reaccumulation period after the Haring so it really depends on how it's looked at really because this looks like March 2020 post harving reaccumulation right over here and then the parabolic phase in the cycle so in actual fact this graphic is a little bit off in the sense that it doesn't consider the entire parabolic phase of the cycle it actually considers reaccumulation so how I'd adjust this is this would be reaccumulation and this would also be reaccumulation and this would also be reaccumulation right over here and then it transitions into the parabolic phase of the
cycle so this reaccumulation that I'm talking about is this post Haring reaccumulation period so to say that this is a ball phase that's that's actually technically quite true but notice how we see that first uptrend then reaccumulation for multiple months and then the parabolic phase of the cycle begins once again we have that initial ball phase here in the preh Haring period and then we have that accumulation reaccumulation phase and then the parabolic phase of the cycle so that's going to be my point of contention with this graphic but nonetheless it's a really poignant and
really informational educational graphic that can give us an idea as to what to expect going forward so 300 days of bullish price action towards the upside that's something really we can start to prepare for and just notice how you know 2018 that's the bare Market 2019 is accumulation period 2020 is the latter part that accumulation period and then 2021 is is probably the the most parabolic phase in the cycle and just notice how 2013 2021 and 2017 those are going to be the most parabolic phases in the cycle and that's 2025 which is really a
month and a half away and so that's where things are going to really start getting crazy and to just give you an idea as to what that's going to really look like 2021 is a really good coroller anal analogous year for bitcoin's price price action when it comes to 2025 then you can see just what lays ahead and how early we are still in this parabolic phase of the cycle when it comes to 2021 we saw for really a very long time this parabolic phase that first uptrend so 1 2 3 4 five six and
we had two dips in an otherwise uninterrupted uptrend before we rallied into still a few more weeks of upside so some 10 weeks 11 weeks of upside in the price Discovery uptrend this first price Discovery uptrend before we saw a corrective period right over here and so this corrective period in fact it only lasted some two to three maybe four weeks and you can see how in later stages of the cycle these retraces can actually get shallower which only showcases the premium buying and aggressiveness in that premium buying behavior on any pullbacks in latter stages
of the parabolic phase of the cycle and so we only have maybe three major retraces this is probably the most notable one of 53% in May for about 3 months or so and this one right over here so we tend to get three major retraces across Cycles in the parabolic phase in of itself and so we haven't yet seen that retrace in this cycle but it still lays ahead and we haven't really seen too many dips so maybe we need to see a few more dipping moments in bitcoin's price action and if we actually conceptualize
that we have have maybe three major Corrections in this parabolic phase of the cycle then people are going to very they're going to treat dips very very differently because well they're really brief shortlived shortterm 10% maybe 15% dipping opportunities before we rally higher and so this graphic right over here it does segment where we are in the cycle but it doesn't tell us anything about these price Discovery uptrends these dips and that's fine because this is a really good graphic when it comes to Market cycle analysis but we're going to be talking about the specific
phases in this bll cycle and specifically probably the the second half of that bull cycle when it comes to price Discovery and price Discovery tends to have a few price Discovery uptrends as per in green and we can see maybe four up to four it's usually three to four price Discovery uptrends and usually three major price Discovery Corrections and so so we are in week three when it comes to this current cycle this is week three and the price Discovery uptrend and that very first price Discovery uptrend and it just gives you an idea as
to where we are in the cycle compared to 2021 maybe we dip a little bit now or maybe we still have some dipping opportunities ahead and we need to climb a little bit higher before we see a bit more dipping opportunities so this dip it's only the very beginning of the week and when we move and zoom in here you can see that every single weekly candle has some sort of downside Wick to it in an uptrend so these sort of uptrending candles this is a typical normal uptrend but we still see downside volatility as
part of that uninterrupted uptrend in the dipping opportunities and of course we also see upside wicks in each of these weekly candles which only demonstrate to us that we tend to also see rejection at resistances at a little bit higher price levels but that's normal rejections and short-term dips are normal because they proceed further upside and you can see how we tend to for example here we were rejecting in this candle and this candle and then we actually break Beyond there and turn that into support and the same thing here as well we reject from
these two levels here and then we turn that into support and rally higher and it's going to be the same thing in this cycle as well we just need to be cognizant on the fact that we're forming new new weekly levels there's one here and there's one here as well so if we form a downside Wick briefly right over here and of course we are forming an upside Wick here but if we form a downside Wick and then continue higher then that's going to Showcase to us that last week this was a weekly resistance and
this week we might actually be turning it into a new support and so this is all normal price behavior and price action in the very first initial price Discovery uptrend and this is an uninterrupted uptrend it's only just begun after a period of 8 months of Psych just psychological boredom whereby it was just consolidation for an extended period of time and now price is ready to enjoy the fruits of the labor that consolidation offered to bitcoin because this is bitcoin's way of showcasing to us that we're exchanging hands between buyers and sellers and bargain buyers
are G garnering in strength sellers are getting washed out from the market and now it's all about buyers being in control and we need to allow for this trend to fully emerge and for the buyers to really enjoy the fruits of their labor and their actions in the form of dollar cost averaging at these regions right over here and now we're going to see this price Discovery uptrend really start to emerge and flourish but of course at some point in the future weeks away still we're going to have a multi-week price Discovery correction and even
before then we're going to have dipping opportunities so it's really important to be prepared for both both at the moment it is by the dip season and it's also altcoin season but then at some point we're going to see strictly Bitcoin season and then we're going to see a season where everything pulls back and that's going to be one of the more higher probability dollar C averaging moments in the market for both altcoins and Bitcoin and it's a high probability correction because the first price Discovery correction is typically the one where we reverse from into
an uptrend and the second correction is also relatively high probability as well but the third one that's probably going to be the r riskiest one it's also going to be the shortest and most shallow one but you don't want to be dollar cost averaging into a fourth major correction because that's probably going to be the bare Market that's going to be a year long so we've covered all the different phases that lay ahead in this parabolic phase of the cycle we've covered also the general Bitcoin Market cycle and where we are in the cycle and
how this graphic perhaps short Falls a little bit short and isn't quite up to date but nonetheless we are currently in this phase of the Bitcoin Market cycle and we're going to be segmenting them into more specifics so that we can really be prepared for what lays ahead and if you want to stay tuned subscribe to the channel feel free to check the rec Capal newsletter in the link in the description down below and sign up for Cutting Edge insights three times a week Bitcoin on Monday altcoin markets on Wednesdays and Fridays altcoin newsletters so
lots to enjoy and direct caps newsletter and lots to enjoy also here on the YouTube channel so feel free to check out direct caps newsletter and sign up today and also subscribe to the YouTube channel here and of course like this video if you'd like to see more videos like this in the future I'm Rex capital and I'll speak to you soon