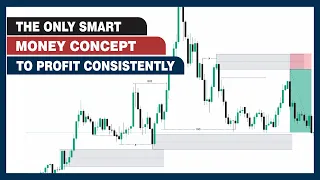
what's up guys welcome back to the channel in today's lesson I'm going to teach you the easiest smart money strategy for 20125 I know you've been struggling in the financial Market you're finding it hard to find a specific smart money concept which you're going to trade in today's lesson what I'm going to do is that I'm going to give you two different patterns you're going to focus on in 2025 and believe me once you master these two patterns you're going to find consistency and the financial markets once you master them and follow the rules I'm
about to give you in today's lesson believe me before the end of 2025 we going to come out profitable I welcome you all to 2025 this is the first video of the Year 2025 and this New Year we bring new opportunities to us I'm excited to continue joining together learning together and growing together as we all journey to financial success believe me you're going to succeed in the financial Market let's make it happen this year as I share valuable content that is actually going to open your eyes to see light in the financial market so
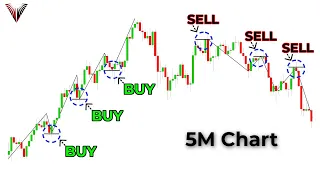
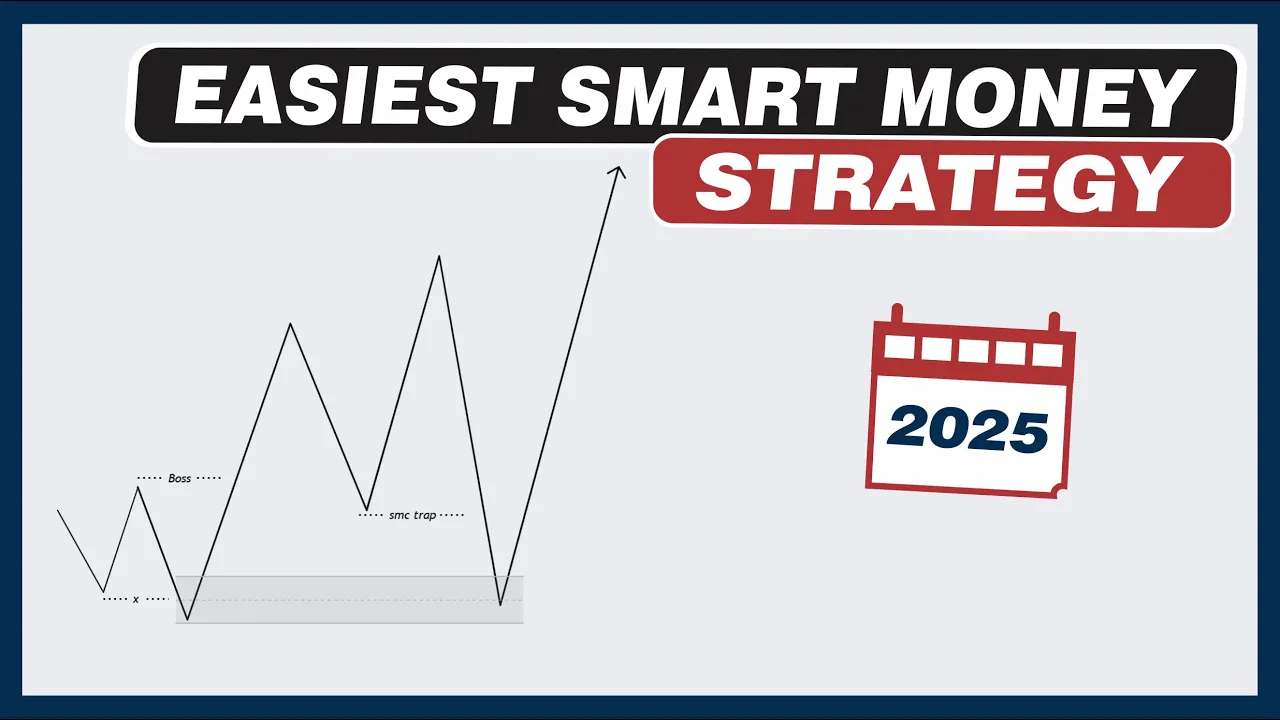
welcome back once again and I appreciate you all for sticking around so let's make 2025 count as we journey to financial success if you new to the channel you can consider subscribing to the channel I'm Solomon wisdom and here is born to trade let's jump straight into what we have for today the easiest smart money concept that is going to make you profitable in 2025 so take a look at the two patterns we have on my screen right now these patterns look very similar but believe me if you take your time to back test the
price actions on the price charts in 2024 you're going to see that these two patterns offered profitable results not just offering profitable results it's repeated countless time in the financial Market that's why I'm here to share this particular pattern and I believe after this lesson you're going to take your time to back test and you're going to take advantage of this particular pattern now this particular pattern I said it played out in 2024 but can you believe that I'm already seeing this price action playing out this year 2025 the market is not even set for
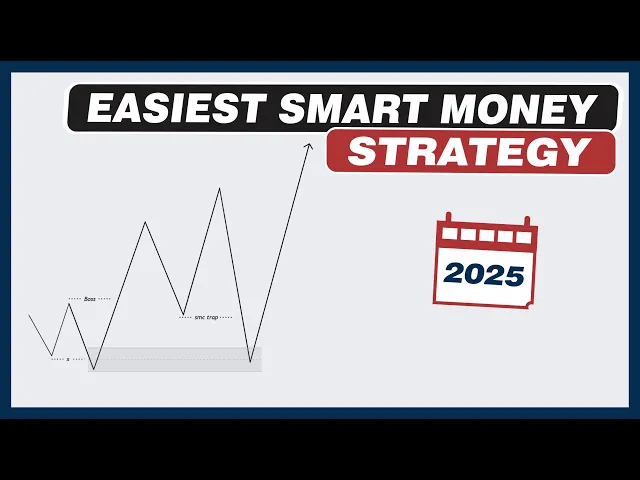
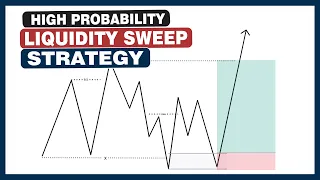
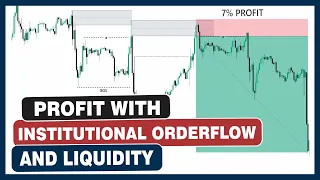
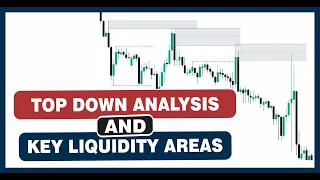
trade but you seeing good price actions like this patterns we have right here in the market and I'm going to show you even one of the results I got today dur my market work through I'm actually going to use it as one of the examples so let's start with the first one we have by my left hand so looking at this particular price action right now what can you clearly see you can clearly see that this is one of my favorite trading pattern where I have a liquidity sweep and I have a break of structure
now the very first thing you want to pay attention to right now is finding a candle that has large bodies right not just having large bodies but it has to be an Institutional candle now what what makes an Institutional candle an Institutional candle should at least have a pricing efficiency what you see an Institutional candle moving with large body so at this particular point we see this candle you know why I'm explaining from this particular part I'm explaining this particular part because maybe if you try to see here first you might get confused in the
market so the first area I want you to pay attention is identifying where we have a large candle and once you identify this large candle the next thing you have to do is to look for your fair value Gap right once price leaves a fair value Gap then this is an Institutional candle right that's the main firstly identify your institutional candle this is the first rule now secondly this is where you have to see what price did while it left this institutional candle was it able to sweep liquidity once you've been able to identify that
liquidity sweep so secondly identify where that institutional candle does what takes liquidity okay once it takes liquidity just have it in mind that this is meeting your criteria right now you understand that this price action is actually meeting your criterias now after you must have identified the second price action which you're looking at then this is where you have to identify either a market structure shift or a break of structure so in this particular case let's assume that we have a break of Market structure right here okay now price breaks Above This high so these
are the three rules I've given you right now firstly you've been able to identify where we have an Institutional candle secondly you've been able to identify where we have this liquidity sweep and you know what liquidity sweep means in the Market at this particular Point money was taken at this particular area because this push the downside swept the money we have at this lows then we have this rapid move to the upside which broke structure now this break of structure simply indicates that we still going to continue bullish right we're going to continue bullish and
it means that there is an Institutional footprint at this particular area okay now once you identify these things the next thing is to identify your demand zone so if it's actually a bearish price action then you're going to look to identify your supply Zone but in this case you're going to Mark our demand zone so from what you can clearly see you can see that this is a very good demand zone now here is the key point this price action we have at this particular area now anywhere you see this kind of price action you
have to pay a very good attention so at this particular point this is the key area you have to pay attention to why looking for this kind of pattern why is here the key area now what are you going to identify at this particular point at this point you see we have the break of this High because price pulled back from here and when price was pulling back everyone have an expectation what is the expectation the expectation is that price is going to come back to mitigate your supply level but in this case price was
not able to get to your supply level instead it continued to the upside and we have the break of of this high so smart Money traders once they see something like this a lot of impatient Traders are looking to trade from here right they're looking to trade from here now this is why I said that this is a key area you have to pay attention to now a lot of liquidity is resting at the low a lot of money is resting at this particular low making it a smart money trap that low is what we
call an inducement area you can go ahead and call it a smart money trap now what you can clearly see is that price reverses from there sweeps the liquidity we have underneath the low and remember before this could be a Val smart money trap that should be an inefficiency below here so that's why I said your instal candle should have a pricing efficiency you see all this Works hand in hand now what you can clearly see is that price comes back D the liquidity we have the mitigation of the level and now we have a
nice reaction to the upside a very simple pattern yes I know I took my time to explain it but have it in mind that this is a very simple pattern identify your institutional candle identify where price sweeps liquidity Mark your break of structure select this level as your demand level now once price comes back and reacts without getting to your point of interest it's very valid and now we have price come back Swit the low and mitigates our level now this is where a lot of people get confused because this particular price action is very
similar to the very first one we have at the left side so let me explain this and after that and we go deeper with maybe one or two explanations so if you see these price actions in different ways it doesn't confuse you and you still go ahead and take the trade now for this particular one is almost the same thing now at this particular area you've been able identified your institutional candle and you know why I said you should firstly try to identify your institutional candle if you trying to look for where price sweeps liquidity
because this low you can agree with me that this is a liquidity sweep so most times if you want to identify the liquidity sweep as the first thing you want to identify it might actually get confusing so just focus on identifying the institutional C of first then after you must have identified that this is where you're going to pay attention to what price does next if it's break structure or if it's a market structure shift now at this particular point you see price starts to return to the points of interest which you've selected because after
price breaks this structure the next thing you're going to do is cting your poy which is the level you're going to trade from now that price is returning you see price came very close to this point of interest and it didn't mitigate it even as it was returning aggressively back to the Zone came very close it didn't mitigate it then we had a little reaction before it drops to mitigate the level so this is another key area you have to pay attention to this little reaction to the upside is actually where a lot of impatient
Traders are getting induced in the market set again okay this is where we have another smart money try because this little reaction a lot of people might feel like okay price doesn't want to get to our Zone because of maybe this kind of thing we saw right here you know at this particular Point price came very close then reacted to the upside right A lot of them might think okay price is going toact to the upside without getting to this zone now this is where they going to enter a lot of position so what smart
money is going to do at this point is sweeping that liquidity at that low okay remember liquidity is what moves the market so so each time you see me looking at the price chart I'm looking for liquidity areas because this is what moves the market now they're going to sweep that liquidity mitigate a level and react to the upside now this is another example right here look at the price action we have by the left side do you know that this particular price action we have right now this and this is the same do you
know is the same just that at this particular point this liquidity is very far away from the zone and this one is very close to the zone so if you see these two different price actions it means the same and if price actually breaks the high all these concepts are just the same just identify this as your inducement area and at this particular point this is another inducement area I hope this makes sense to you so this is the easiest strategy that going to make you profitable in the financial Market that's if you want to
trade smart money concept okay after you this concept make sure you go back to your price sh and practice so let's see life examples and I believe this life examples is actually going to help you understand it better and it's going to help you during your back test so let's see the first example which is going to be on dxy the 30 minutes time frame so I hope you can clearly see it here dxy 30 minutes time frame so this is dxy 30 minutes time frame and you can agree with me that this price action
is on the particular level right here is on 30th of December 2024 so is a recent price action during the end of 24 we had this price action now this is where I want you to pay attention to all the rules I gave to you so the first rule I said you should be able to identify what an Institutional candle right so looking at this price action can you see an Institutional candle yes we have an Institutional candle where is it this candle right here is an Institutional candle and it has pricing efficiency I hope
you can clearly see this pricing efficiency here so this is an Institutional candle now that you've been able to identify your institutional candle I said something else I said that you should be able to identify what re price Swifts liquidity because liquidity sweep is actually very important and necessary so this is where we have that liquidity sweep okay price takes the liquidity onne this low we see that move to the down side which takes the liquidity underne this low sweeping the liquidity of ret Traders this is your price revers to the upside and if I
try to zoom out you're going to see that we had price pulling back inside an internal structure so the same price is trying to do right now is to Target this external range liquidity we have at this particular area you see this particular high is actually going to be the Target now let me explain further apart from the rules because understanding the general context of the market is actually very important if I try to zoom out right now what you can clearly see is that the overall trend of the market is bullish right the overall
trend of the market is bullish and if you try to zoom into the price action we looking at you see that this is actually a bullish price action that means we looking to trade to the upside and we have a Target where is our Target this external range liquidity now you see that price break structure right here and it pulls back inside this range now the pull back inside this range is a normal price action which we usually see in the market because after pullbacks this is where we going to have the continuation of the
price action right this is what we are expecting in this market because if you look at it from the daily time frame you're going to see that this is a break of the high this is the pull back and after the pull back we're going to have a continuation so this is our expectation in this market so now you understand what price is trying to do price is trying to Target the buy side the liquidity I hope this makes sense to you now so after we've identified the institutional candle identifi the liquidity sweep this is
where we have the break off this high right price breaks this high so try to zoom out you're going to see that this is actually a market structure shift sh in this case price shifting in each structure now you've identified the third row the next thing to do is to select your demand zone so marking your demand zone right now we have a range created demand Zone which could be refined on the lower time frame so you've identified all that and you can clearly see that at this particular Point price breaks Above This high you
can agree with me that we have the inducement area right here this is a smart money trap right now okay this a smart money trap seeing this alone has now improved the probability of this setup playing out and if you look underneath it we have fair value Gap so the probability of this playing out has now improved now let's press price for now you see price drops to the downside now and this is the second example I showed you now you can agree with me that the two price actions I showed you when I was
doing the sketch the one we had on the right hand side is the very first liquidity inducement area we have right now and you see price presenting the second one right here as well we price comes very close to your point of interest and then builds a liquidity area I hope you see that you see this reaction to the upside a lot of people is actually going to jump into trading from here thinking maybe price is not going to get to the level but price is going to sweep this liquidity and you see this is
exactly what price did price comes back sweeps liquidity underne this low and we're going to anticipate a reaction to the upside see price s the liquidity Taps into our Zone and now price is reacting to the upside now in order not to be greedy in the market Market the first thing you can do is you can actually take the high right here as your first take profit right you can take this high as your first take profit and you can actually go ahead and Target to external range liquidity so let's press price forward and see
now price hits the first Target sweeps theal range liquidity we have a little pull back and price actually moved far away from here so and after that you see how price blast and contined to the upside so this is a very profitable strategy you can clearly see that this particular price ction presented itself around 30th of December then we had this mitigation on the 31st of December that was actually the last price action before we entered New Year and you see this is a very very good example let me show you another example this particular
one I spoted today and it was actually shared to the students on my VIP so let's see it right now so this is my VIP Channel this particular lesson I'm actually recording it on the 8th of January so this is the setup right here on audusd so Market work through not trading yet so I wasn't trading I will start trading officially on 13th of January right that's next week so this is the price action right here and I believe you you've seen some of the rules I explained in this particular example and if I try
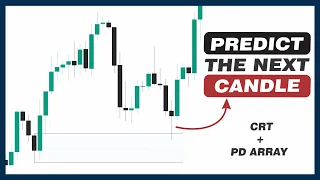
to scroll down this the this actually another price action on gbpusd but that's not what we're looking at currently so this is the Au setup when it hits to Target right so I'm actually going to explain that in few seconds so AUD USD hits Target as well I'm not trading here just analyzing the market so this actually the second one this is the CLT pattern right GBP USD daily time frame expecting this pair to drop based on CRT right so it's this is actually where I had another Confluence that gave me the confidence that the
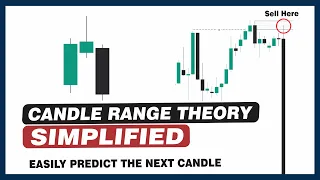
GBP USD setup is going to drop then this is where I gave them where they should Place their targets and this is where it plays out smoothly so this is actually the kendle range Theory I've actually explained the kendle r Theory a lot of times right I've explained that so if you really want to trade these Concepts I have lessons on that so these are the lessons we have on the kandle Range Theory this the first lesson I made the kendle range Theory explained and simplified that's the first lesson here is the second lesson I
actually made as well kendle how to how to use the kendle Theory and PD for high probability tra so you can actually watch these two lessons if you want to understand the second concept which is the candle range Theory but let's continue with the examples that's the AUD USD setup so here is the AUD USD setup and this is on the 15 minutes time frame so let's start looking for the rules which is going to make it a high probability trade opportunity so firstly we have what an Institutional candle as always that's PST R and
if you look at this you can clearly see that this is an Institutional candle candles with large body reacting to the downside and it's left an inefficiency right now so seeing this alone has now made you to understand okay this actually a good area you should pay attention to secondly I said you should identify a liquidity sweep so at this particular Point here could serve as S price SS liquidity because you see we have this particular high price we forms the low move to the upside sweeps the high before it drops massively to the downside
we actually have another good Confluence right here where price mitigates this level so this mitigation right here has now explained to you okay the other flow is bearish and there is need to trade with the order flow if I try to zoom out you see price is reacting to the downside the order flow of the market is bearish so we have to continue with bearish o flow in this particular case now at this particular Point what are we going to look at which is going to also give us the confidence that this is a valid
trade opportunity this is where we identify the break of structure because you see price is trending to the downside so it's a valid break of structure to the downside now you've identified all these the next thing you're going to do is to mark your point of interest and one mistake a lot of people do is they don't mark their point of Interest correctly so this is the right point of Interest you're going to Mark is another block which can also be called a PIV created Supply level now what is the expectation in this case we
didn't have where price buil liquidity and break structure to the downside instead price is returning back to our Zone more like an aggressive return now the expectation is that price is going to build some kind of liquidity before it mitigates this point of Interest so playing price forward right now price buil liquidity even though it came very close to a point of interest but it didn't mitigate the zone so here is the liquidity area right here this is is smart money trap okay this is smart money trap now this has now improved the probability of
this Zone playing out and remember this particular setup was shared today I spot it and I shared to the community but I didn't take the trade TR be told I didn't take the trade I'm not trading currently so playing price forward you see price CES back and we have the mitigation you see how price starts into there after it reach the liquidity and we have the drop now playing price forward you see how price reacts massively to the downside and this is where price is currently today being the 8th of January right this a recent
priz action I hope this concept you're actually going to take your time to practice it I think I should show you one more example but before that let me introduce our mentorship our Advanced smart money mentorship is still running I trate smart money Concepts and I teach smart money concept so if you have interest in enrolling for mentorship where I'm going to guide you on how to learn all the concept and how you can find consistency in the markets this mentorship is still running so in a mentorship if you enroll you're going to have access
to our Advanced smart money course I'm going to give you access to the course and you're going to be part of our weekly chart breakdown if you've been following me for a very long time you know that I am my VIP students we always analyze and break down the market you're going to have access to the VIP support group the group where you see me sharing the tra opportunities and you see some of the students are allowed to sh what to see in the markets there as well going to have access to our premium possible
setup so on our main VIP that's where I share our main trading opportunities the trades you can approach and trade now we're going to be part of our live sessions okay you're going to be part of our live session so if you have interest in enrolling for this mentorship it cost $216 and if you actually interested in enrolling you can click on pay now this is where you can make your payments and have it in mind that once you complete the mentorship you're actually going to have your certificate right so these are some of the
reviews from my students these are the reviews now you can go ahead and read up but if you think you are doing better on your own you can as well decide not to enroll but if you think you need someone who is going to guide you I think you should enroll for the mentorship so let's see the last example so this is going to be the last example for today right going to be the last example now if you look at what price is doing you can clearly see that price is bullish and this is
actually on audjpy on the two hour time frame and this particular price action happened between second of October 2024 okay in case of your personal back test now what you can clearly see is that price react to the upside and it was able to break this high so which is valid and one thing I said you should do is for you to be able to is being able to identify an insal candle insal candle that has pricing efficiency I hope you can clearly spot it right there now the next thing to do is to identify
where price sweeps liquidity right and you can agree with me that we have a liquidity sweep right here you see price sweeps the liquidity underne this low then a little price action right here before momentum kicked into the market and we had that reaction to the upside which was able to break structure so these are good price actions you want to see now the next thing to do is to mark your zone right this is a very good point point of interest if you want to mark your demand Zone but most times I don't love
trading this kind of Zone because trading this kind of Zone you have to put your stop loss underneath this low okay which is going to make it very large but this is a very good point of Interest now the next thing you're going to identify right here is your smart money trap and you can clearly see how price pulls back and react to the upside when it reacted to your upside it was able to break above this particular high this is a valid smart money trap right now so so seeing this inducement area right now
has now given you the confidence that okay this is a very good trade opportunity now playing price for right now you see how price comes sweeps it and mitigates at demand level now price starts to move away even though the price action right here is actually very slow and very chubby but what you can clearly see is that it respects our Zone and we have a very good reaction to the upside price played a lot before we have the to the upsite so if I start to show you examples I actually have a lot of
examples where price respects this particular pattern you see price was able to take the external range liquidity as well now what I'm saying is that I have a lot of examples where price respects this pattern and this strategy I just shared today this is the easiest smart money strategy you can trade in 2025 and if you actually need my support why identifying this concept you can decide to join my free telegram Community the link is in description once you join that Community if you have any challenge or any problem why trying to trade this concept
you can as well text me privately and I'm going to give you my support and give you advice in anywhere in case you're making mistake while trying to trade this concept okay this is the little support I'm going to offer you this year so thanks very much for watching this this particular one if you're new to the channel consider subscribing to the channel so thanks very much once again and see you in the next lesson