what's going on traders welcome back to my channel i just want to elaborate a little bit more on the video that i was trading live and kind of analyze the rest of the day but the first trade that i took was this second entry long but why was i looking for longs at that point well the day started looking as a trading range but the key factor to notice here is the big bullish move up when you work into trading range higher you can expect probably to break higher if you work into trading range lower
the most likely break is going to be lower so at this point when i saw this big bullish lag move into the trading range even though we were quite close to these highs i was still looking at the opportunity to go long this channel has not been retested yet this was the first break of this channel working higher and it is a first entry pullback second entry long market moves in twos two like a pullback and it's off to ema ema serves as a key entry point at this point so at this point it was
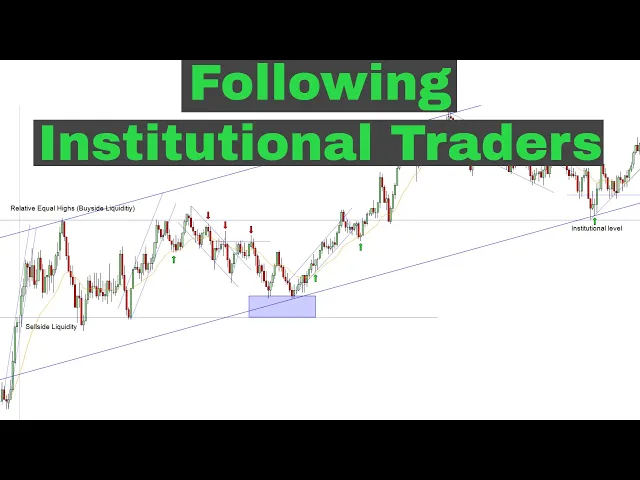
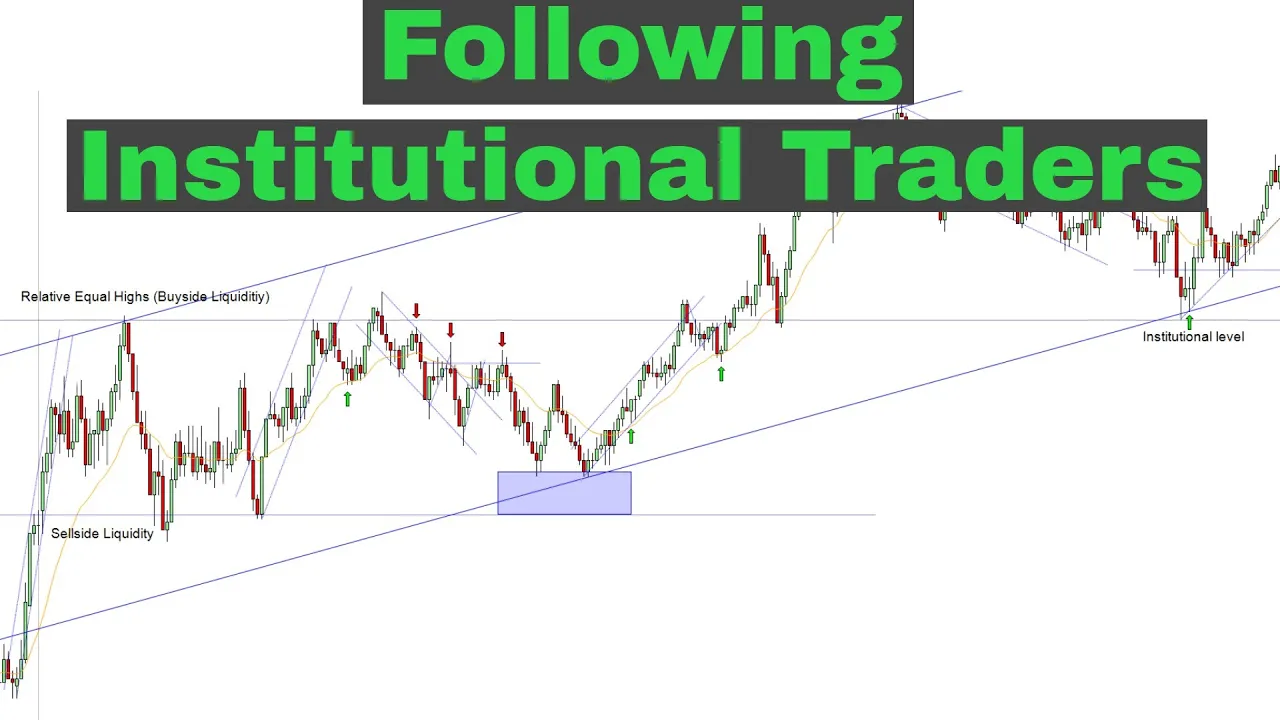
a good enough for a quick easy scalp now prices broke above this key resistance level i marked this as a buy side liquidity what is buy side liquid liquidity basically buy stops buy orders ready to go long on the break of the market and all these buy stops have been swept during this break they have not been purged they have been swept and what does swept mean well the orders are swept if the current daily bias current daily bias bar is bullish this is the daily chart and you can see that the previous few bars
will were bullish so we can expect the day be bullish as well so that's why those orders were swept and not purged but i don't think you just want to go short on this first break higher because it's much higher probability for wait for prices to pull back and wait for a lower lower high at this point or overall this was a lower high from this point it is a re-test of the previous resistance i didn't take this trade as you obviously could have seen on the video but nevertheless i should have taken it it
was my mental mistake it is a good good shot to go here and you can see you can draw the trend line you have to draw the short return trend line the prices are now working lower after sweeping of buy side liquidity you i've been now looking for shorts so when the price is bottomed out here you got a trend line working higher you have a break and a new high and this is a first entry pullback second entry so this is a two legged pullback to the trend line two i pull back to the
ema so ema holds trend line holds and it is a second entry so three three key factors of the strategy are now screaming at you to go short here it was such a good trap that my limit order didn't get filled and i missed this trade but this was a good proper entry and then the prices came back retested made a triple top the correction once again working higher you need to draw the short term trend lines if you're the trader to keep you on the right side of the market you have a break you
have a new high and the triple top is holding at this point and now i'm still waiting for a new low of this trend line actually the signal bar is supposed to be here single arrow and the market now moved down you know it was good enough easy enough for scalp but at this point since this is a trading range i am expecting prices go up and down up and down i'm expecting prices to go down here but notice this is very important notice how the prices didn't make it on the first attempt to these
lows so this was you know this should have caught your attention and when the market second attempt felt as well to make these lows now you have to abandon your trading rules you know strategy and you have to focus now on going long because if this was a proper range day the prices should have easily bottomed down down here at this key level but price is two times failed and look at this big gap from the support you know this shouldn't have happened if there is enough you know barrel bears in the market and also
this confirmed that the daily bus this is basically when you cut the dairy look at the daily chart you can now get kind of an idea that this really is probably going to be a bullish day so how do you trade it how do you find the opportunity to go along well the same as always you wait for key entry points and you wait for second entries so prices made a new low here they're working higher first entry to go short first attempt by the bears to go short it failed it serves as a you
know beginning of you drawing your trend line prices are working higher above the ema the ema is holding it's not letting prices go down and trend line is holding and not letting prices to go down and it is a two-legged pullback on the ema on the trend line two attempts by the bears and market moves in twos always remember so this was a good opportunity to you know if you if you connected with the daily bass to go long you now confirmed the opportunity to go long and you can see prices are working higher higher
at this point i always teach you not to go long at the resistance and not to go short at the support but why was this two-legged pullback once again always remember market moves in twos two legged pullback you you have a break new low it is off the ema ema is holding i just remove the ema and you can clearly see that it's much harder without ema to recognize where the prices are most likely to continue in you know after the correction to continue in the direction of the trade so i'm gonna put the ema
back but the reason why is too like a pullback to the ema into the resistance is a good long it's because the fact that the trading range you know we didn't make it to the lower side we didn't make it to support we made a big gap here two attempts failed and it is a clear sign now as the prices spike through the ema that the bears have no control over the market so this was a good you got a little bit more room you know regardless but you know you want to abandon your bearish
beliefs at this point from this point this was a key indicator that the prices are not making it to the lower side and the bears have to win the towel and this is what you can see the prices broke higher pull back at the key level prices will retest the key levels this is just a first entry for us as the day traders to go long i i'm betting you know there was a lot of institutions develop went along here but you know i'm a big fan of second entry so i don't think you want
to go long here it is a very tempting but at this point yeah i kind of still think you want to wait for a second entry so you kind of have to watch it this setup to go higher and at this point mark is pushing higher higher a big time at this point market is feeling very over overbought so there is no surprise that there is correction but you don't want to just go short because you know remember the daily bias was up the daily bearish candle was bullish and probably two more candles before that
so the only reason why i marked this short according to our rules is because this swing confirmed kind of not confirmed set up the trend line and we got a confirmed bounce off the trend line this is a first entry pullback second entry ema is holding trend line is holding i'm not the big fan of shorting this but it is according to the rules and you cannot parry shake cherry pick excuse me so i have marked this but since the daily bias was up you know i would be still waiting for possibility to go long
at this point but you know after a big move like that you know this is very very steep steep move if you if you look at this this is very this is almost you know like it's like 80 degrees so there is going to be correction there is no doubt that there is going to be correction people are going to take their profits and they're going to trap a few more shorts so there is a you know chance to just get a quick scalp it is off to trendline and once again trend lines work phenomenally
you have a break you get a two legs to a new low and notice this the legs are measured there is a ram and reason to everything that happens in the market and notice how this previous resistance now acting as a support prices came all the way back to retest this level and i guarantee you all the people that that miss this breakout all the institutions piled up right here they they just touched it barely and you know hesitations this must have been you know thousands of contracts institutions you know banking their orders right here
waiting for prices to go back into this key level so once again this is no good setup for us to go long this is a horrible signal bar but once you trap all these people going shorter there's actually somebody going short into this you know proven key level and they don't understand how to read the price action and you actually once they once it reverse on them we can be basically buying their pain you know market spiked up on them this was a bad bad idea to go short into this key level you have a
break of this trend line 2 lakhs to a new low you know this was a very good loan at this point now the prices are kind of trapping along through the ema the ema is flat and it's kind of in the middle of those bars so i really think you want to you know stay on the sidelines do it during this consolidation because the proper way to buy low and sell high you don't want to you know chase the market so i don't think even though it worked and it's off the trend lines few setups
here i still think you kind of want to wait and once the prices came back and then you know the support is clearly now holding multiple multiple attempts you know and the daily boss is up these basic this is a double bottom triple bottom quadruple bottom these triple quadruple bottoms were good entries to go long in my opinion you probably would have been trading at this point because this was this is uh 21.53 and the market closed 23 exactly so yeah this is only one hour before the close so it's not you know i recommend
you not to trade before the close because you know the market can make some crazy moves but you know just remember the ski levels are very important to find and there is a ryman reason why prices are acting a certain way and that this was a big factor you know that the prices are now in a bullish trend because we should have clearly make it if this is a proper range we should have clearly make it higher and i forgot to mention this i've drawn this earlier which basically as you can see now added more
weight to the to these setups right here so this there is a rhyming reason why prices act a certain way and if you study the chart enough and you immerse yourself in it you can actually you know figure it out how the institutions trade you can follow them this is basically what i'm doing i'm just a day trader i don't swing so i just follow the institution and i follow you know there's their steps because i don't know what they're gonna do you know they have the deep pockets they know what they're gonna do whether
they're gonna sell or buy but i don't know what they're gonna do i just gonna follow their footprints and you know get a little bit of money of what their move that they making so go zoom in a little bit more the big shame was i missed this straight this was a good trap and at this point i was still you know thinking i could get a few more scalps to the short height but nevertheless from this point you have to reverse the daily bus is up and the trend is now working higher all these
buy stops are now getting swept excuse me sell stops and uh that was it for for today so i'm gonna wrap it up just remember keep studying your chart this is doable and i'll see you guys in the next video have a safe trading bye guys