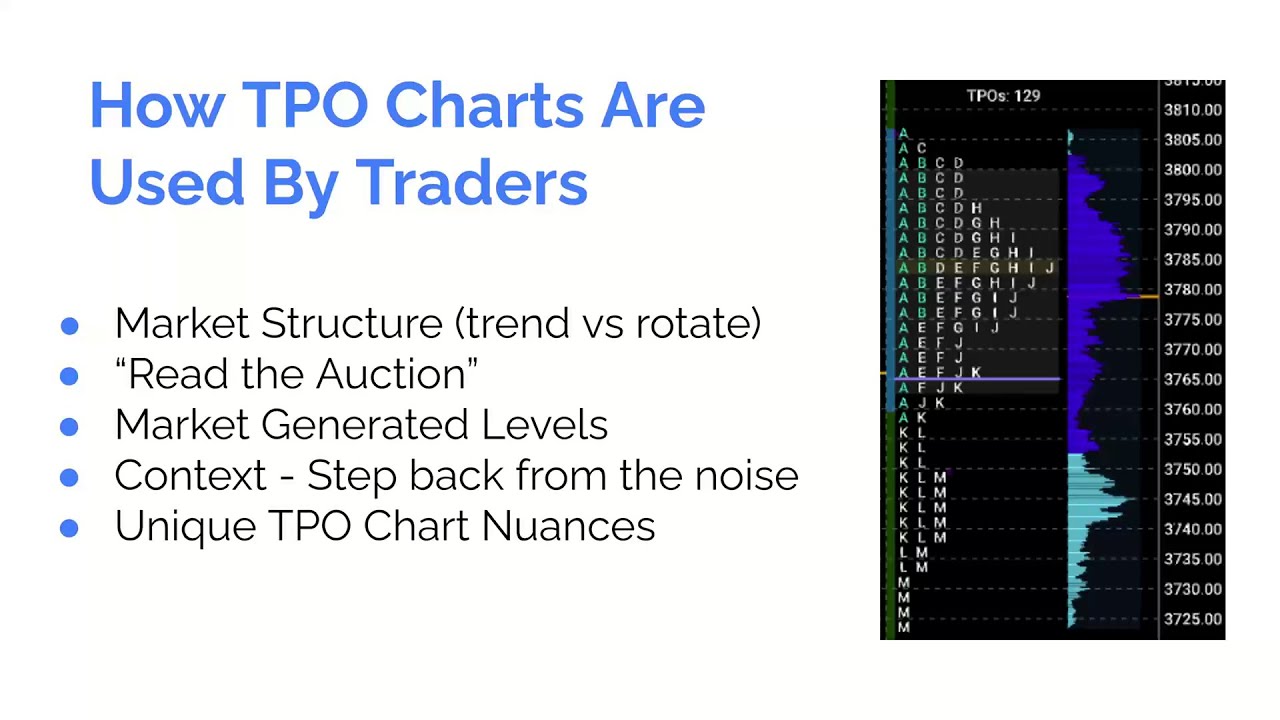
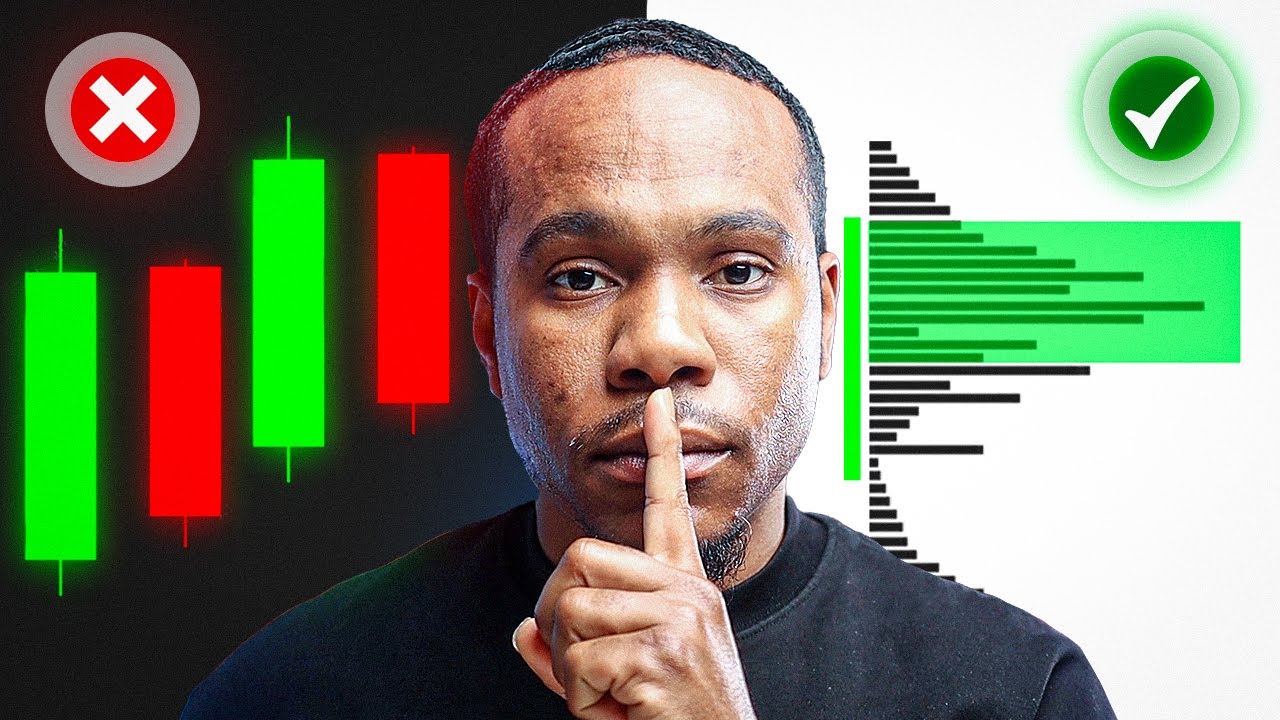
all right so we've gone over what a TPO chart is so we've covered what a TPO chart is how it's constructed the things that we are going to be looking at and using moving forward now let's talk about why so why would we use a TPO chart why would we use a Time price opportunity chart or Market profile or a tool like this to begin with so first we need to understand what we see normally when we look at a Candlestick chart so each one of these candles is a daily Candlestick and I have different
color settings and you might have I have white for up candles black for Down Candles and you'll see that Traders will do this from time to time and it helps remove any kind of bias you associate with any color particularly red and green You'll Think of red in you know normal everyday life as being somewhat of a symbol of negativity or red for a stop sign read for danger red for caution or warning in green sort of green means go green means good right green means growth and the last thing you want to do is
have any kind of interaction that occurs on the chart start to create a behavior on your part that is sort of let's say unwarranted right so if you see a green Candlestick suddenly you're getting greedy you're thinking of you know it's time to buy because we have a big green Candlestick so the purpose of changing the colors of the candles is to remove any bias that's connected with that but I will tell you that you end up just associating the same sort of response with the new colors that you set right so now I know
obviously a big white candle a big black candle ultimately I know what's behind that activity and you could say that that ultimately creates the same sort of bias in the long run but moving along each one of these candles is a daily candle so it's a single 24-hour session and there are four data points on each candle so we have in this case of the candle upward we have an open a close a high and a low in this case of a candle downward same here same here same here we have an open a close
a high and a low now you might look at candles and if you see a candle that has let's say more body okay then candles that have more Wick you might interpret the body as you know sign of presence or a sign of strength or sign that there was a lot of buying activity aggression right it's a large candle now this doesn't tell any story as to what takes place underneath the surface so we really don't see you know what goes on in terms of where we spent the most amount of time and where the
most volume was transacted so that's why we look into something like Market profile and volume profile while you use both of them together so if we use this candle for example so we're going to go to the 23rd right so we have the 23rd right here if we were to look at this on a 30 minute time frame this is that day session so a big move upward all right so big move upward ended up closing right around here again if you look at this on a daily Candlestick you know you don't really know what
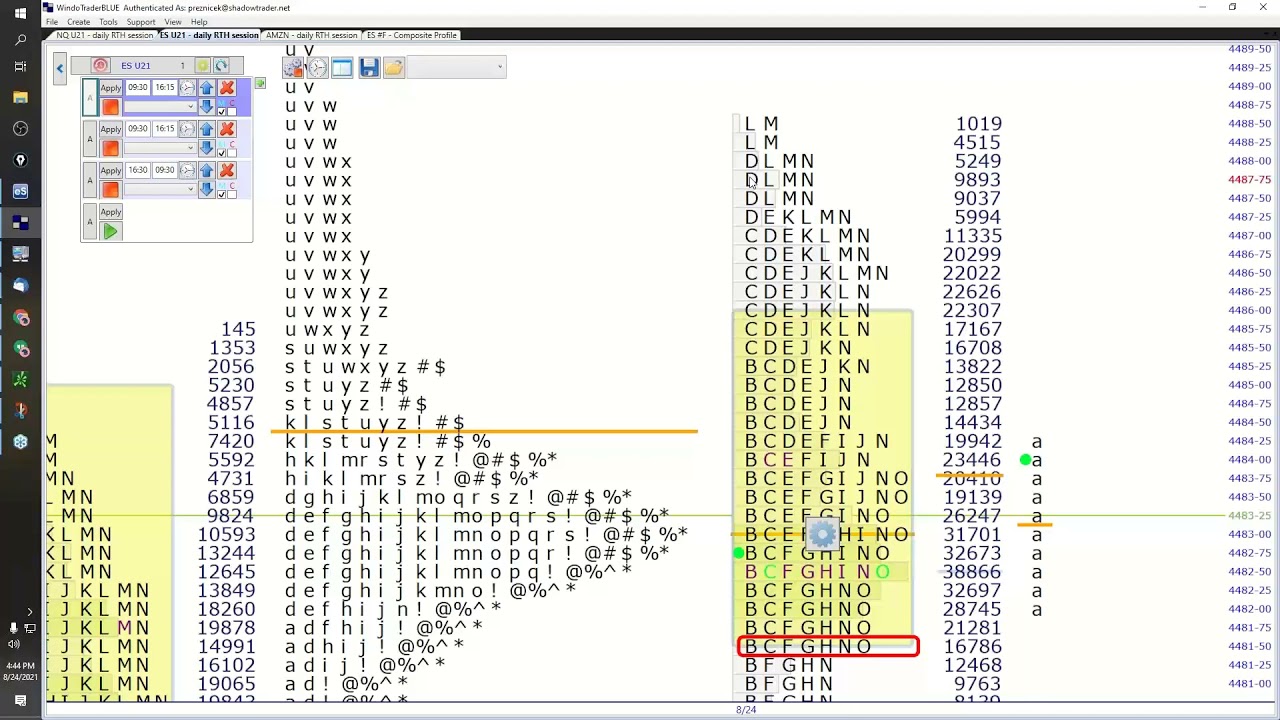
goes on up here all right unless you're going to go through every single candle you know scrolling all the way back into your lower time frames to really see that you know ultimately if you went on to a five minute chart it's even more as to what occurred specifically at these levels now when we use Market profile we get a complete picture so here's that same candle here's a candle of the 23rd we see the open so I'm going to just zoom in slightly so we see the open right here the close as indicated by
the red triangle and one thing should stand out we close right here if we look at this that's the close right there but the truth is that most of the volume actually took place above the close so here's the close it's right under 7 500 and most of the volume and most of the participation or rather presence of presence and participation when I say participation I mean volume when I say presence I mean time so how much time we spent in the area most of both of those were spent above the close Okay so most
of the volume most of the time in this daily session was spent above this candle close so you wouldn't know if you're just looking at a daily Candlestick that we close below where most of this participation and presence occurred right so this candle is an imbalanced candle you might not necessarily know that by just looking at the daily Candlestick right you might not necessarily know that in the center of this candle if we look at this daily candle again that there wasn't really any substantial volume in the middle of that candle it's pretty imbalanced from
open to close it was pretty one-sided we came back decently we had a large response where we barely spent any time at the high kick backed most of the volume above the close you wouldn't know that this was so imbalanced necessarily you know this a daily candle can look like a trending day where this could be all filled out you know this particular candle we see that this is more of a double distribution and it's very imbalanced and we're going to get into all of those obviously so by looking at Market profile we get a
complete idea of what occurred throughout this session and we're going to be looking at obviously Market profile for 24-Hour periods and we went over how each one of these bars within is one half hour period throughout that day so we get a complete idea as to what's taking place within this structure right it organizes data in a very easy to understand visual manner right so rather than looking at multiple candle closes on a 30 minute time frame and a five minute time frame and all this back and forth very quickly we can see in a
case like let's say for example the 24th or on our daily candle this is more of a spinning top large Wick to downside large Wick to the upside barely have any open close distance when we look at this on the TPO chart we see that this is a relatively balanced structure we see that slightly more volume and participation occurred above the close but it is fairly balanced right so we immediately have some level of context that if we open up today and we opened up right outside of this day we would see immediately where we
were sitting with regards to where most of the volume occurred and where most of the time was spent so it immediately begins to shape the market in a way that is not seen unless you're using a chart like this and paying attention to the distribution so we could think of these types of distributions and when we look for balance structures in particular as the type of balance gaussian distributions that you look for in in a regular distribution chart and we shared this on the road maps and and we'll be referring to those time and time
again because ultimately there's a lot of theory there and we go over a bunch of this stuff where we're looking at ultimately something like this balance distribution and this will be when we talk about looking for developing value this is a balanced structure right where we have 34 34 right outside of one standard deviation or one standard deviation is 68 percent so this is the sort of balance structure and we would see this on Market profile and be able to say that that was a balanced day right balanced day with more of a response at
the low because very quickly the market came out of that area slightly more presence in the high but a balance structure overall compared to a day structure like this okay and only through looking at this type of tool can you really begin to put things in context and organize data in this matter right otherwise if we were to open up this structure and look at everything as it is unraveled you don't really get a complete idea right you don't really have an understanding of where we spent the most amount of time you don't have an
understanding of where we spent the most amount of volume you don't know if those two even confirm each other so this again helps us organize data in easy to understand visual display so immediately you could see whether or not something is balanced okay relatively balanced so we'll look at a few charts on here that are balanced or tpos this is a balanced structure as balanced as it gets within this area this is the most balanced structure down here okay and then your imbalance structures which are your Trends and a trend is a market that is
moving from balanced area to New Balance area to new balanced area Okay less balanced structures are very obvious right this makes it very clear when the market is in balance or in imbalance meaning out of balance right when it's not balanced so this helps us get an A daily idea of our environment type current daily context and how we are evolving through time this also makes it very easy to see significant levels moving forward so just as an example just pull this forward I can get this uh change this drawing tool we can see for
example let's say that this is the current day we're in and we have none of this over here we could see immediately that there is a significant Gap within what looks like a pretty substantial structure in this daily candle right very big candle to the upside you know looks like a powerful daily candle moving up through a level no resistance okay now we can see immediately where the next area of friction and significant level is if we were to lose this structure so if we were to gain acceptance back into this Gap and these Concepts
will obviously be going over it on the further modules but we can immediately see that the next area if we're looking at this window right here and let's say that we're currently in this day the next area of a significant level is within this daily structure so it's a prior day okay it is a prior day it's from April 23rd and it is a high volume node within that day so Market profile helps us really contextualize and shape our environment in a way that is not as visually obvious when you're just looking at a Candlestick
chart when you're just looking at this you might not necessarily know that over the course of a few days that we are in Balance right you might not necessarily know when we're coming out of balance okay you're just looking at arbitrary highs and lows maybe using daily closes weekly closes things that do have more strength but then on the lower time frames you're kind of just building a story as it goes off of things that are really not that substantial when you look at something like Market profile you know we'll get further into this what
we can do is we can begin to combine the area within a range and to see okay within the last three days now I know what the context of this structure was right were we in Balance were we out of balance okay is most of our volume at the high or is it at the low like down here where is volume being and value being established over time so this is why we use Market profile it helps us organize data in a very easy to read manner in that we can immediately see markets in Balance
we're looking for a break from balance Market is trending it's constantly re-establishing value we're able to do all these things in a very fast Manner and this is how we're going to be sort of establishing the levels that we're going to be looking toward when we combine order flow and Market profile


![[FREE WEBINAR] John Carter's New Small Lot Formula](https://img.youtube.com/vi/Q0YmRPjIWtw/maxresdefault.jpg)