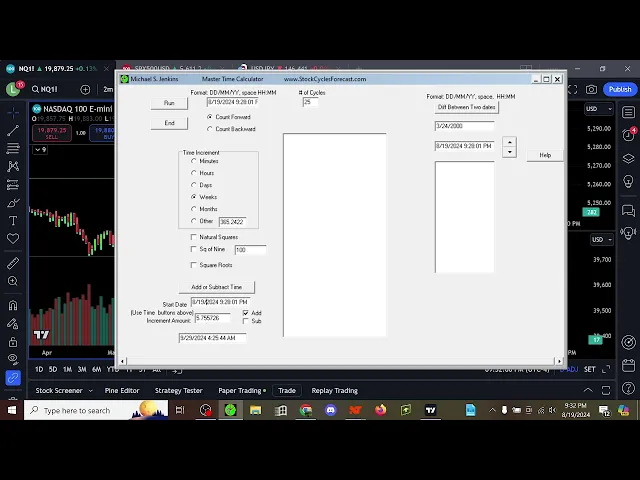
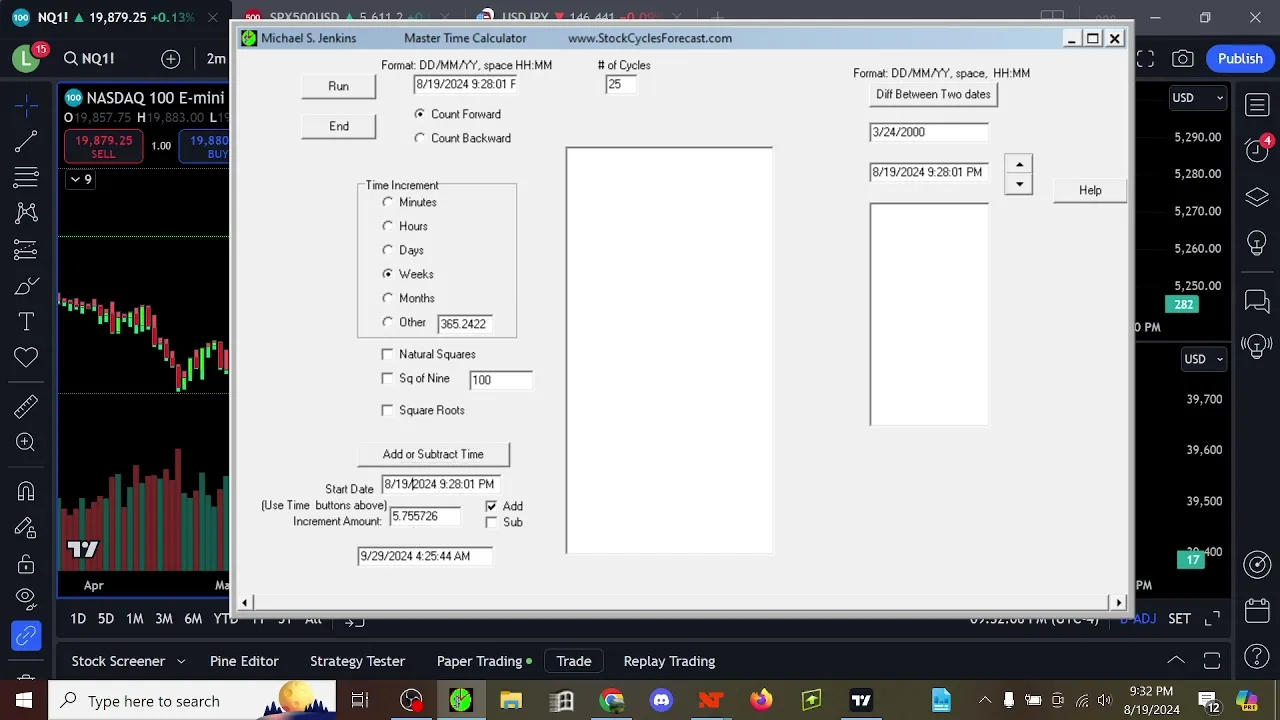
all right guys how's it going um I actually today wanted to kind of throw it back way back to some of the more origins of my channel and uh show you some Michael Michael S Jenkins uh techniques now these techniques actually are ones he discussed but I just it was the result of me playing around with the ones he taught me um and I had not much but I had brief email correspondence with him for a few months where we would go back and forth and I would show him findings and there were some things that I found out and on unfortunately kind of to my disappointment he it seems like he's more interested in just selling courses now than actually discussing like how to make trading work so I don't think he took me that seriously which is disappointing because I found some really interesting things but anyway he's probably very busy you know I know he's got a family he's got kids and all that he's old now he's probably kind of going to retire soon but anyway one thing that I figured out that you could use is the I think I projected some of these turns using it so and this called actually some good turns in the market sometimes off by a day sometimes right in the middle of a move but like here I stopped counting them before that because I'm trading using other systems but um anyway that's all the pass Let's uh let's go into how that how that works so the thing with the NASDAQ is it's such a high um value that using his techniques is kind of hard because you end up with very strange numbers that when you're trying to use them as short-term time Cycles you're going to get some weird stuff I mean it still works but it's it's not going to produce as many results so what I figured out is that if you do one divided by this value stuff like that um you can actually get some pretty predictable or you can predict the future pretty well so for example I'm going to take I want to go back a bit so that we can actually see how well it does but we're going to take this low here the low is uh 17374 okay so we're going to um we're going to do one divided by what was it again um 17374 17374 okay now the fact that it's got all these this doesn't matter what you want is the actual digits because this you're going to get a seed this is a seed number this seed number can be used as a Time cycle okay so and then you can do other things like that you can take the square root of this this this number right here it doesn't matter the point decimal points it's the same you take the square root of that um you can square it you'll see some interesting results um but anyway so first we're going to just start with that number so we're going to use our Master time calculator if you don't know what this is you should have watched his videos okay he has this on his website please don't ask me in the comments how do you get this okay I'm not going to answer you go look at his channel figure out his website and you can get it on his website okay so don't ask me about that anyway we're going to paste that value and then we'll we can put a decimal point wherever we want so for example um 5. 7 weeks oops sorry from what's the date 41 1924 gonna add that oh that actually hasn't happened yet wait wait oh sorry I did the wrong thing I'm baked and I haven't used this in a while but um 419 I was like hold on there's no way okay so May 30th okay so that first date comes out to right here one day one day off the low for a swing that's pretty good okay let's do0 57 months you're going to get May 7th now this one is a little bit in the future or a little bit close so it might not be as good but look now when you're getting highs on the NASDAQ you don't necessarily want to short because the thing is with the NASDAQ like I said you shouldn't really be shorting this so when you get a high maybe that's a good day to sell a position but I wouldn't go short so you're really trying to catch lows if it looks like here could be a high I would just kind of keep watching what you're trying to do is catch a low like here you might want to buy below the low of this candle the next day if it goes there that you probably catch a low pretty well that way um stop-loss wise I don't know you just might you know cuz can go down a lot so you might have to look on a lower time frame to see how you're going to try to enter but you could be expecting a to happen there um okay anyway let's keep going . 57 years later yeah that's obviously going to be uh out in the future um what we can do is do 575 hours later get May 13th okay again one day before a low before it goes up now I mean obviously that one's not great so um and this is just the basic building block so this value isn't necessarily super powerful it's when you take the square root or Square it that's when it tends to get more powerful but I'm showing you this first before we get into all of that okay um and again you could do again 5.
75 this will be in the future but you might want to save that date you know there could be a big shift in the market that after that day or a minor shift um you could also go like I think 05 years later and get May 10th which is pretty close to um I think a low we already had marked out but yeah so it kind of was a high this one was kind of right before a low so but again sometimes the market is not very volatile and so it's these candles are so small that the high or low doesn't look very pronounced um usually when you go further out in the future you get bigger turns so unfortunately this value isn't giving us a lot of options for you know a few months in the future so we're going to have to do something to try to find other values so what we're going to do is we're going to take um 57 57 55726 wait what was it sorry 5755 726 okay we're going to square it oh I should have done um I should do a decimal then just so it doesn't 5755 726 we're going to square that there that way it just shows us the full number okay so we're going to take this value and paste that in now what what could we do we could do 33. 1 days later right May May 23rd look at that perfect top perfect top see that okay you could do 3. 31 Weeks Later May 13th we already have that uh date from the other one too you will notice that a lot of the time it will give you same similar dates which is kind of weird but it's I mean it kind of makes sense too so that's two things are pointing to this so you know around this date you should be trying to find if it's a high and going to go down or a low and going to go up that's kind of tricky there though so it wasn't very clear there but if it had been more clear would have been a good trade opportunity okay we can do 3.
31 months later July 29th that's very recent so let's go to July 29th now this is more of a short-term high but as you can see it's a high right before signific can drop the next day um again they're not always going to be the best but sometimes they will be okay now we're going to do 0. 331 years later that comes out to basically today okay that is good to know okay I think there we may have hit a top in the market then for at least for the short term it could also be the middle of a move though the market may have topped out though that's very useful to that's very good information okay let good to know um I mean it may top out for a few days a week a month a year unlikely but anyway it could be a short-term High okay now so that's the square now even more powerful tends to be the square root so we're going to take the square root and do um 5755 726 57 55726 this is going to be a good value okay watch this this is my favorite one to do the square root okay so we're going to take out the decimal we're going to move it to where we want to so we will try 23. 9 days later now I didn't show minutes or hours but you can actually with this one I'll start with that so what you could do is you would have to make it a bigger number but you could be like 2,399 hours later that's only going to be or sorry minutes later sorry if we're doing minutes then we're going to go one more further out actually maybe two further out n that's too far in the future so this points to May 6th if we go to May 6th here and and by the way I'm going to clear these out just so it doesn't get too uh muddy but you've already seen them okay so I actually remember putting this one from another time so this is one day before the top but obviously it kept going which is like again when it's a top you don't really want to short you just know it might go down a little bit for the following days or it could go down a lot but um I don't short so what you'd want to do then is go like 2399 hours later see where that goes July 28th didn't um look at that now you have to go to the next day because it's on a weekend but that's a short-term high right before that drop and I think that was pointed to by a previous calculation right so again they tend to line up isn't that interesting okay now you could do 239 now obviously this hasn't happened yet but it's a date you could save um you could do 23.
9 weeks later that hasn't happened yet either you could do 2 point oops 2. 39 months later I bet this one will be interesting July 1st okay let's look at July 1 look at that July 1 a swing low in the market good opportunity to Long trade anyway you could do 239 years later July 16th okay let's look at what July 16th is now I believe this is you know kind of pointing to right there there was a high the day before big drop in the market afterwards it's not always going to be perfect that's why this alone is not going to make you profitable Trader but it can give you dates to look be like okay within one day or before or one day after this there could be a shift in the market okay so that's why it's useful it's not something necessarily to trade off alone but it's just something to be like okay look where you want to actually try to take a long trade when maybe you want to sell your long trade okay so that's some more methods um anyway you don't have to do it like that though that you know um you could do pick a different low or a different high so you could pick this High let's pick this High okay this high is 20371 we could just take the square root of it we don't have to do the reciprocal with it we can just do the actual number 20371 there you go you get a number this is a seed for a for a Time cycle look at this we're going to not add it in years we're going to add it in days September 9th well we're not quite there yet but that could be a shift in the market okay we could do this many hours later June 18th okay let's go to June 18th again oh basically one day before that major high or not major but like it's a noticeable high in the market okay that's not a coincidence um you could do I don't you do 14 weeks later get July 28th again see how it's pointing to the same day multiple times that's third third time that dat has been pointed to that's again that's no coincidence that's you know there's something going on here could do 1.