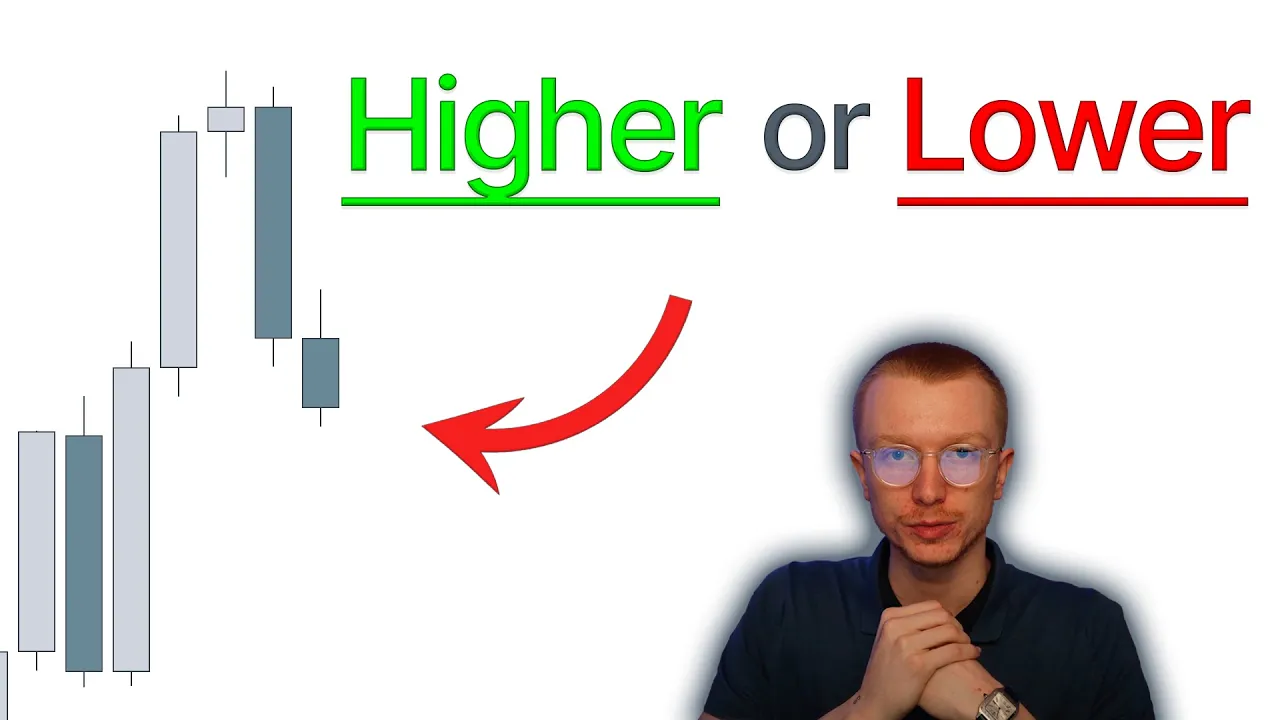
if I ask you to explain to me your daily bias in stepbystep manner are you able to answer that question that is exactly what we are going to be touching on today finding our daily Biers using fair value gaps in a stepbystep manner so diving straight into it we see fair value gaps volume two where the previous episode of course was fair Val gaps volume one now if we dive into section one it is very important to understand that we need to be able to define words so the first step is defining the word bias
so we are on the exact same page if I were to ask you hey can you give me a pen and you have no idea what a pen is in the first place then of course it's going to be very difficult to actually find a pen now the only thing you can then do is make a guess and in trading we do not want to guess we want to make make sure that we have a trade ID where the odds are in our favor where we have a higher probability over one thing happening than the
other thing so with bias we never want to guess we want to make sure that we understand what the highest probability move is going to be for the market to do next so if we Define the word bias then we need to understand the first step in defining a bias is the direction so a bias this is a direction are we going higher in other words are we bullish are we going lower in other words are we bearish that is the direction then the next step is once you find the direction you now need to
find the draw on liquidity in other words the do and in other words your target so what is price actually targeting when it is going higher when it is going lower now that we've defined a bias and we know what we're actually talking about of course we need to go over what then is that direction and what then is that draw on liquidity so that is where we move on to section two where the first step again is determining the direction and when you want to determine the direction the first step is you need to
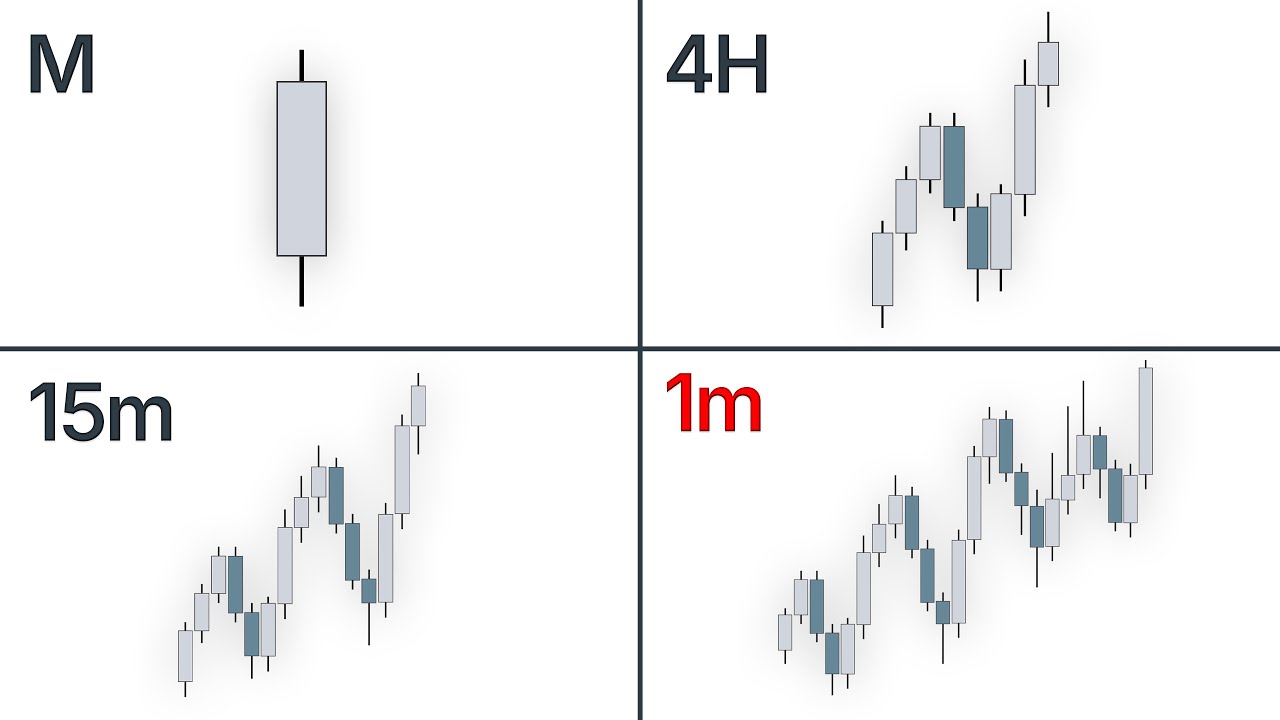
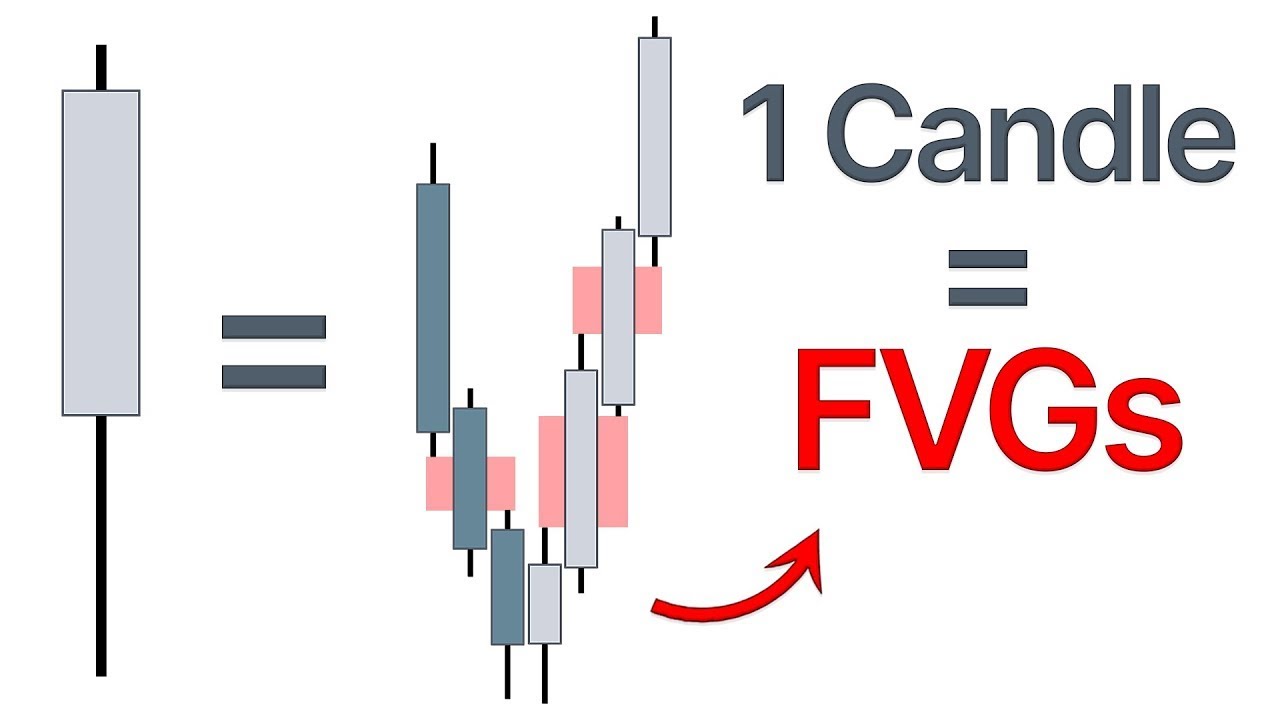
pay attention to recent candles the second step is recent fair value gaps and before I show you this in a chart I want to go over this example on the right side of our screen because we have one bullish Candle on the left and one bullish Candle on the right side and in the middle we have versus now can you spot the difference between these bullish candles they're both bullish but they tell us a different story they tell us a different direction and different fair value gaps let's say this was the most recent monthly candle
then this candle the one on the left side is where the body of the the candle is bigger and the Wicks on the top and the bottom are smaller now since this is a bullish candle it is very important to pay attention to the top Wick if the wick is small and the body is Big so the body big relatively seen to the Wicks we can confidently say right there that the body is big and the wick at the top is small then that means that is a high close so that candle is a high
close then the candle we see on on the right the other bullish candle is where we have a smaller body and at the top we have a longer Wick right there where both are bullish candles but they tell us a different direction they tell us a different story because the first bullish candle tells us confidently that the next candle is likely also going to be a bullish candle why is that in one single Candle on the monthly time frame if you go into that monthly candle then on the time frames below that on the weekly
daily 4our of course there are going to be multiple candles so in One Singular monthly candle and again this is all relative so that can also be on different time frames in One Singular candle there's going to be fair value gaps on the time frame below that so the story that the fair value gaps are telling us in that first High closed Candle on the left is that we have bullish fair value gaps on the lower time frame inside of that candle which means that we just simply have momentum going higher still where the second
Candle on the right side we see a long Wick which means that first price came all the way to the top of that Wick and then rejected lower retraced lower again that indicates that we potentially had bullish fair value gaps going higher first on the lower time frame but after we see a rejection right there that now indicates that we have bearish fair value gaps going lower on the lower time frame so One Singular candle already tells us a lot and tells us exactly a story of what happened on the lower time frame so for
us to know what is happening on the one minute time frame we can just simply look at one single monthly candle and we know what is happening on the lower time frame which determines our Direction now what does this look like in a chart all right here we are on NASDAQ on the monthly time frame and the first step again to finding that direction is looking at the most recent Candles now I want to go over these most recent candles right there with the most recent candles I want you to look at the most recent
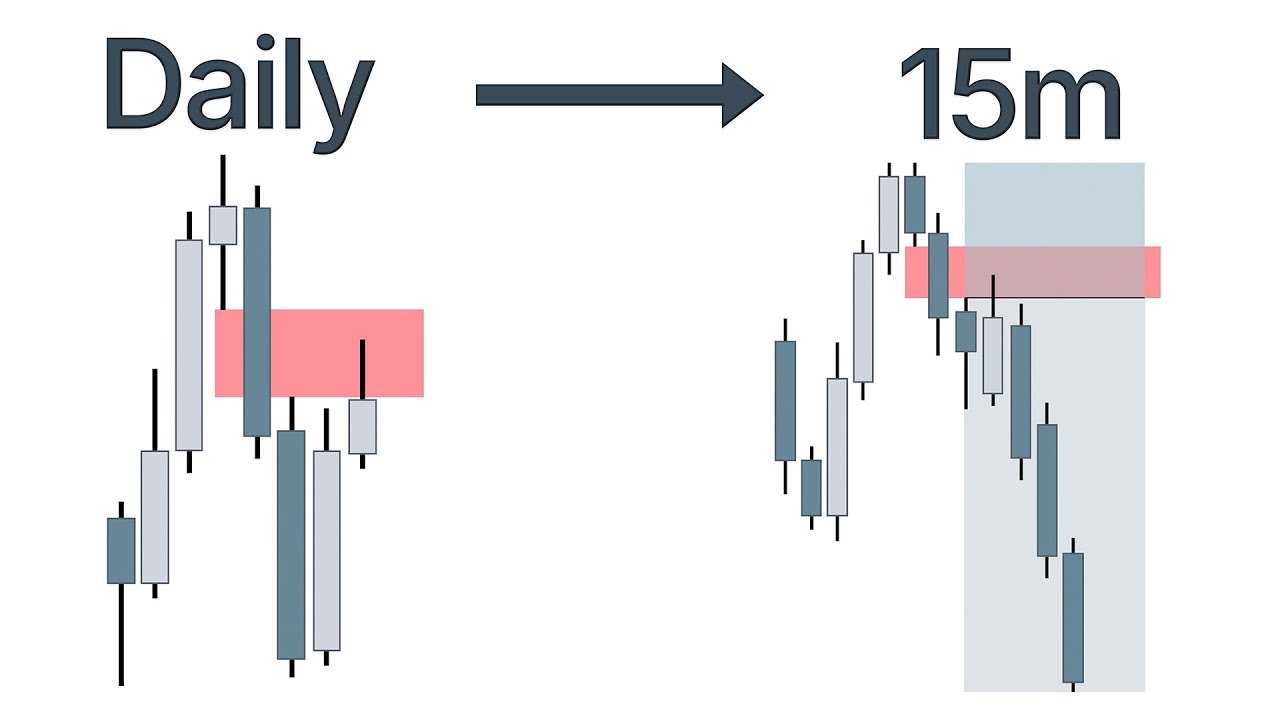
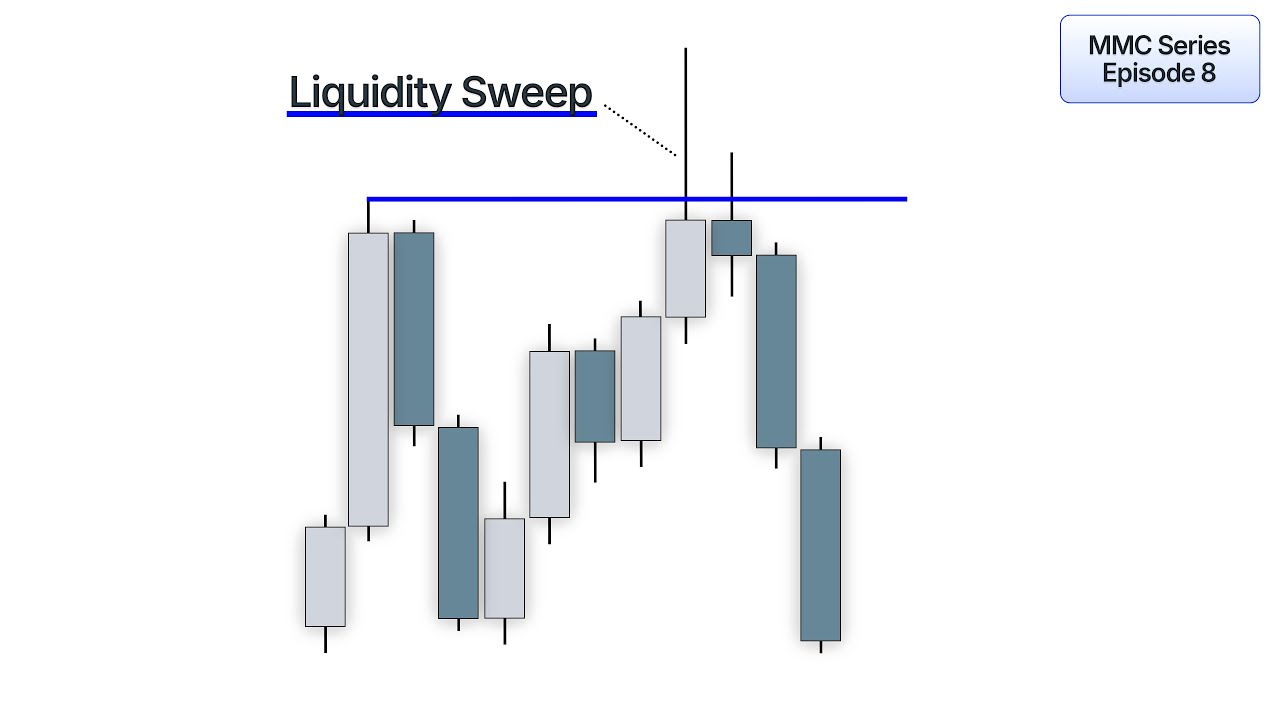
two candles so on any time frame that you are looking at and that you are trying to determine Direction on look at the most recent two candles where the most recent one is of course the most important one and when we look at this most recent one and we also understand that this is a breaker so this is a discount array that we actually came into already we also came into what we came into this overlapping Gap right there and the next thing we can see when we look at the most recent candle that formed
we see that we have a wick that is respecting the overlapping Gap and the breaker respecting meaning that it's only Wick it and it's not closing inside of it this indicates to me right there that that on the lower time frame is already a displacement going higher and with displacement displacement is defined by fair value gaps displacement is for Value gaps for Value gaps again is the momentum so the momentum right there is starting to shift because we are seeing on the higher time frame a long Wick which on the lower time frame indicat Ates
that we have bullish fair value gaps sitting right there all right so we have read the recent candle right now now if you now also look at the recent fair value gaps do we have bullish fair value gaps right there or bearish fair value gaps on the monthly time frame we have only had bullish fair value gaps we have not created an expansion phase of a bearish fair Val Gap we are not even close to creating a bearish fair value Gap so overall the momentum on the monthly time frame is still bullish it's still likely
to continue higher and the recent candle right there supports the ID by respecting that overlapping Gap now the next candle becomes very interesting because in the next candle we don't necessarily need to know exactly where the next candle is going to trade towards once the candle is forming after one week of that candle forming on the monthly time frame FR so after the first week of that month you could see that we are continuing higher right there very simply said if we are continuing higher very simply said if that monthly candle right there is going
higher then we are likely going higher very simply said if that monthly candle is showing bullish price action here on the monthly so it's an up candle then we are likely going to continue higher and it is seen again through that same ID of that body right because this up candle and the body of that up candle is quite high it's a small Wick so clearly there's bullish intention right there now to confirm this bullish intention of the higher time frame candle we can go into the lower time frame so the time frames below that
candle to confirm the ID with recent fair value gaps again so if we dive into the weekly time frame and on the the weekly time frame we can see by reading that monthly candle that we had we saw that we were likely pointing higher so likely expecting bullish prices just purely based on the monthly candle that monthly candle inside that monthly candle you have weekly fair value gaps right there and potentially of course Daily 4 Hour the higher time frame so here on the weekly we are seeing fair value gaps which of course as we
know them are breakway gaps right there which eventually We Leave Behind a new weekly fair value Gap now this is where it gets very interesting because if we read every single individual candle right there and the reason why we use Breakaway gaps and why we differentiate them from actual fair value gaps is because of this simple fact of reading the singular candles where if we read the singular candles we have this first fair value Gap sitting right there which becomes comes a breakaway Gap why is that simply said because this candle is a very high
close High close lower time frame fa Val gaps already pointing higher so no bearishness at all the next Candle on the weekly right there is again a high close so this again becomes a breakway gap right there because that candle on the lower time frame again has bullish fair value gaps now the next fair value Gap right there becomes very interesting because as we know it we don't close above this second candle high that F gap which to us is the first sign and again I repeat is the first sign and not the only sign
is the first sign that we might want to trade back into this weekly fi Gap the second sign is that we have a wick a long Wick at top relatively seen to the body right there that is the second sign that we want to trade into that Weekly fire gap because those long Wicks the second candle right there as well indicate that we have bearish fair value gaps on the lower time frame right there which are pointing towards this weekly fair value Gap and now once we come into that Weekly fair value Gap the interesting
thing happens again where we are respecting this weekly F Gap by again a long way Wick that long wick on the 4our has what on the time frames below the weekly has fair value gaps pointing higher right there and we don't even need to go into the lower time frame because we already see those fair value gaps just purely by looking at the weekly long Wick that we have sitting right there so by understanding the bodies and by reading those bodies we have a great understanding of where price actually wants to trade towards we now
have the basic understanding of the direction now we are going to go over more examples on NASDAQ right here as well later on in the video but in order for me to be able to fully explain it we need to First understand the draw on liquidity which leads me back to the PowerPoint and then we move on to section three because in section three we are now going to determine the draw on liquidity now first step that we have in determining the draw onqu liquidity is our Direction without the direction we don't know what the
draw on liquidity actually is going to be we don't know where the market is actually targeting the direction in this step can also be seen us again so those recent candles and the recent fair value gaps where are the fair value gaps pointing towards do we have bullish fair value gaps or bearish fair value gaps then the next step is and the second step in determining the draw liquidity is the PD Ray we need to understand that when we have a draw on liquidity the draw on liquidity and the target is always going to be
a PD price always moves from PDR to PDR so we are always targeting a PDR now then we also need to be on the same level because we need to be able to determine and to Define what actually a PD is if you're not sure about any PD Rays I would highly advise to go over the a toz guide the first few videos as well well but the PD rays that we are using for our draw on liquidity and in general are the following the first one is a mitigation block then we have a breaker
block then we have an order block then we have a fair value Gap after that we have a swing High and a swing low the last PD rate that we use is a previous candle High and a previous candle low which for example can be previous month's High previous month's low but not limited to the monthly right can also be on the weekly on The Daily on the 4our and even lower so those PD Rays is exactly what we use as our targets that is our draw on liquidity so now by having that knowledge let's
dive back into NASDAQ now here we are back on NASDAQ and we delete everything and we go over the monthly time frame again the same situation then we discussed we came into this breaker into the overlapping Gap as well we were respecting it right there then at this moment in time we have a draw on liquidity right a draw on liquidity and when you come into the chart you likely already understand what we went over briefly the direction the next thing we need to do is I want you to Mark out the two closest PD
rays and what I mean by that is I want you to Mark out the closest premium array and I want you to Mark out the closest discount array the closest discount array at this moment in time on a monthly level is of course this previous month's low and I'm not talking about the breaker I'm not talking about the overlapping Gap right there because we already came into those so when we already came into those they can't act as a draw liquidity twice draw liquidity is only a onetime thing so the previous month's low right there
is the closest discount array now the previous month's high sitting right there is actually the closest premium array then after marking out the closest premium array and the closest discount array I want you to do the following I now want you to Mark out the next premium array and the next discount array so after this premium array that we have right there the previous month's High what is the next premium array the next premium array is this swing high and again that is completely objective right there is no mistake there's no confusion right there on
what the the premium arrays actually are so after this previous month high this right there is the next premium array what is the next premium array after that well the only premium array that we have right there is actually an altime high is this next swing high again yes we have a fair value Gap but we already came into it it already acted as a draw on liquidity before so again a mitigated Gap cannot act as a draw on liquidity so those are the premium arrays that we can aim for now below this discount array
what is the next discount array that price can reach for well in this case we have this overlapping gap which we already came into we already came into the high of the breaker what I do like to do is also Mark out the body of the breaker right there so we have two draw liquidities potentially the wick and the body after that the next discount array becomes this swing low sitting right there there's a reason why I do not use this order block because there is no fair value Gap after it there's no forup that
it leaves behind so for me then it's not a valid PD valid PD valid mitigation block valid breaker block valid or block always need to leave behind a fair value Gap so we have determined the closest premium and discount arrays now it is up to us to deter determine which premium array or which discount array are we going to trade into first so if we add that context of the direction that we already had right we had the context of Direction with the recent candle right there already showing signs of bullishness because we are coming
off of a discount array in the form of that breaker and the overlapping Gap then we also had the recent for vars being bullish right there so this recent candle could already continue higher at that moment in time we are not too sure if it can actually continue higher it can first of all reach for this previous month's low right and then continue higher potentially now since we already have this Wick that is respecting the discount rates that is already an indication that we do not want to sweep this previous month's low right there and
we already want to continue higher and I'll show you more examples of that later on as well so after this candle is forming right there and we are just simply said moving higher on this candle then what is the first premium rate that we encounter and that we can aim for well the first draw liquidity is this previous month's high right there after reaching that previous month High what is the next premium rate because clearly it's not showing any signs of stopping it is this next swing high sitting right there which eventually we also deliver
to and by delivering towards That Swing high is actually first going to the weekly time frame because on the weekly time frame we talked about this weekly fair value Gap sitting right there which based on the candles we can trade back into before we actually continue higher and when we trade back into that what do we actually see with this candle closing that Weekly candle closing after coming into that Weekly V into that discount rate we see it's respecting that is having lower time frame bullish fair value gaps showing displacement continuing Higher by just simply
reading the candle the next draw liquidity on the weekly time frame is first of all this previous week high after that it's this swing high after that it is this high sitting right there and now the next interesting thing is do we have any fair value value gaps on the weekly on the monthly time frame sitting right there in between that high and where current price action is right there no so we are clearly not offering fair value so what are we doing we are seeking liquidity right there so if we are seeking liquidity because
well there is no fair value to offer right there then the liquidity is this high right there that is the draw liquidity with all these small premium rat because those are the closest premium rays are the first draw liquidities but the ultimate draw liquidity is sitting right there and then eventually it is this high sitting right there as well with on the weekly we can also see that we first of all have this fair value Gap and we first of all also have this order block sitting right there before we actually arrive to those all-time
highs now you might say these drawn liquidities are are we just going to Mark out every single thing in the world no it's very important to understand that the weekly the monthly and the daily can already determine your draw liity very confidently especially when you go looking all the way at the left right there you want to stick to the Daily and the weekly and the monthly otherwise you're going to drive yourself insane with the amount of lines that you have on the chart right there now to now to now to remove move some lines
we can again use the same logic that if this high is likely to NE draw liquidity we have no fair value gap on the weekly in between that there's no real reason to continue lower right there perfect then this high is definitely as well a next Target and when this high is getting traded above then what is very likely then the next very likely thing is that this high is also gone because in between that high and this High there's no reason to continue lower off of that without first sweeping that high potentially so now
we have already created from three draw liquidities Just One Singular draw liquidity very easy and the reason for that is again because we don't want to have a thousand lines with potential draw liquidities on our chart but it is very important to understand that these price movements right there these next draw on liquidities allows you to understand where you can actually look to trade because you know when we reach those levels you want to take a small step back and see if we actually do want to reach for the next draw liquidity because of course
and the reason why we then select the closest premium array and the closest discount array is very simple because the closest premium array and the closest discount array are the highest probability for price to actually trade into meaning that the further away your draw on liquidity is going to to be right there the more risk you are going to have that price is going to take a long time before it actually reaches that draw liquidity and what I mean by that is that this first draw liquidity is pretty high probability I mean it's pretty obvious
even if you were not a Trader that price might want to trade into that level right there after that the next one that is already a little bit lower probability why simply because it's further away is this draw on right there but that draw liquidity is higher probability to actually be reached than this drawn liquidity sitting right there why is that simply again because this draw liquidity is further away now this drawn liquidity is a higher probability to be reached though than this draw liquidity and why is that again because this draw liquidity is just
further away so let's say we only had this drawn liquidity at the top top right there then we are simply lost we need those small targets those small draw on liquidities to be able to know when we can look to trade and when we need to stop looking to trade and that is why for your drawn liquidity or your target the target and the draw liquidity is always going to be the closest premium rate or the closest discount array and after that is the next closest discount array and the next closest premium rate that is
very important to understand where if we look at this example as well on the same exact price action and we first go into the monthly again on the monthly once this candle was forming actually what is currently the next closest discount array well we also know that we have this Breakaway Gap sitting right there which we already tapped into but once we do retrace like that we have this fair value Gap that Breakaway Gap and this Breakaway Gap so we are likely going to come into the overlapping part sitting right there so this at this
moment in time is the closest draw liquidity before so this breaker high is the next closest draw liquidity because before that we actually have this previous week low sitting right there so that is where we can now go into the monthly potentially to see all right we have these discount rays that could be the draw liquidity simply because we are closest to them we also have this premium array right there what do we actually want to trade into first on the weekly time frame what are we seeing on the weekly time frame we have a
long Wick to the downside right there in that down candle which creates this fair value Gap that we can actually look to trade back into why is that because this is not closing below this second candle low but more importantly it has a long Wick at the bottom right there which is is very important so after that we come into the weekly fair value Gap now when we come into the weekly fa Val the first candle that come comes into that is actually a pretty high close right pretty high close since this is a high
close the next candle is more likely going to aim for this previous week high first before it actually continues lower right there and then again like we mentioned in the previous video and why that is important to understand this is now a mitigated Gap once we come into it perfect we ignore it the only thing that we can continue lower from right there if we did not reject right there meaning we did not close below the fair value Gap right there you can see we are closing inside of it that indicates that we first want
to sweep this previous weak high before we actually want to continue lower so this will be the premium rate that we actually continue lower from where we had the previous month's low right there which was a Target and we also now have the previous week low they're very close to each other right there so we use again the previous month's low instead because if the previous week low is getting reached then the previous month low as well is getting reached right there now currently we are right there we are sweeping above that previous week high
and we can see that we are respecting it why because we have a long Wick indicating bearish fair value gaps so so now the time is right to already continue lower of that Weekly F Gap and more so continuing lower of that previous week high right there with the next candle being bearish what is the draw liquidity this is the first draw liquidity so in between moving from this premium rate to that discount rate that is exactly where you look to get involved which eventually ends up being your narrative which again we're all going to
go over in next videos as well so price is aiming for this draw on liquidity and after that what's the next draw on liquidity we had determined it to be this draw on liquidity right there we first reach that one after we reach that one right there and then eventually like we saw on the monthly because we have a monthly candle close then we see the same story over and over and over again what is the next premium Ray right there swing High We reached this premium in the form of that Weekly previous week high
right there next premium rate swing High next premium rate That Swing High next premum R these swing highs right there same story over and over and over so we're constantly determining are we first going to come into a discount rate as a draw liquidity or into our premium rate as a draw liquidity and that is read through understanding the candles right there and that is exactly how we determine our draw draw on liquidity what is the direction telling us and that direction is simply telling us all right do we first want to trade into a
discount array or into the closest premium array now that leads us to section four because this is touching again a little bit on that previous episode the three candle Theory where the first step in understanding that three candle theory was again that Breakaway Gap and the different gaps that we had the Breakaway Gap the fair value Gap the mitigated Gap and the overlapping Gap now as we mentioned in this video the first indication that it is a breakaway Gap is for example that we have this situation on the left right there the left fair value
Gap that indicates to us that that could potentially be a breakaway Gap but sometimes we still see price trading back into the fvi Gap into the Breakaway Gap to then continue higher why is that we need to understand what we mentioned in the first video the first first episode how the market moves that first statement of closing above the second candle high is a statement about probability and a statement about probability just simply is all right we are now more likely to do this instead of doing this with a breakaway Gap that is of course
we are more likely to already continue higher instead of retracing into the fair value Gap that is probabilities that is not binary I need you to understand that is probabilities if you don't understand that then you're going to have a very difficult time as a Trader Now by that Breakaway Gap statement and by understanding the rules that create a breakaway Gap we already know that is high probability the second thing that makes that even higher probability is having lower time frame support so when we have a higher time frame Gap that is the first step
then in order for us to actually see if we want to trade back into that Gap if we want to already continue higher or trade back into to that Gap we need lower time frame support so we need to see what the lower time frame is telling us so if we go over that example then let's take a quick look at es right here now on ES in 15 days approximately 15 days and 17 hours we are creating a monthly F Gap potentially right there now if this monthly fi Gap was to be created is
it very high probability to trade back into that monthly for Gap well first argument would be well based on aro's rules of actually being a fair value Gap and understanding what is the highest probability yes we can look to trade into that based on the direction of a singular candle and based on how we determine our bias right there this particular candle if it were to close exactly at this moment then that is a very high close right which indicates that on the lower time frame we already had fair value gaps going higher right there
so then is it very high probability to actually trade into that fair value Gap no it is not so the lower time frame support the lower time frame plays a supporting role right there because we are reading that lower time frame first off by reading that singular candle next of all if we go into the weekly and we go into the daily right there what are we actually seeing we already have a daily for Value Gap higher right there so the lower time frame plays a supporting role again where at this moment in time once
we came into the weekly fair value area which we talked about right here we mentioned we can continue higher with the first draw liquidity or is the first draw liquidity actually it is again this first previous week high after that it is this swing high sitting right there with the first drawn liquidity being of course the highest probability to actually reach that we re respect the fair value area right there and the overlapping Gap by seeing again those wigs beautiful to see and afterwards we create a daily Fair V Gap higher which actually is a
daily fa V Gap now in the mentorship and in the money-making team I mentioned we are likely not going to trade back into that daily fi gap before we reach the draw liquidity in the form of that previous week high and potentially this swing high but why is that because clearly based on the rules this is a fair value Gap yes that is indeed a fair value Gap but that fair value Gap if we pay close attention to the way this last and the third candle closes right there this long Wick already indicates to us
that that is displacement that is fair value gaps higher on the lower time frame so the lower time frame already tells us right there that we simply do not want to trade back into this fair value gap before we already continue higher so what do we do we already go into the 4 Hour into the 1 hour to find those fair value gaps to already continue higher off of that instead of looking and waiting and hoping for potentially this daily F Gap to be hit we already knew that daily for Gap is likely not going
to get hit so this is why I mentioned the Breakaway Gap Rule and the fair value Gap rule is just the first indication and this is also why I mentioned the previous video is just the top of the iceberg there's a lot more going into this so on The Daily time frame we again asked ourselves the same question that we did in the previous episode on The Daily right there are we first going for the draw liquidity or are we first going for this fair value Gap well because this candle does not show intention to
trade back into this daily fi Gap we are first going for the draw on liquidity now with the next example we are looking at the dollar everything mentioned in this video of course also works on Forex right so here on the dollar we are looking at the monthly time frame and the monthly time frame currently since this is live is creating this breakway Gap in first instance and the first rule that we go over we understand all right that is a breakaway Gap now my mind does not go into that is a breakaway Gap so
we are 100% definitely not trading back into that before we are reaching the draw liquidity right there we keep an open mind and we say all right we could potentially already continue lower before we come into that breakway Gap nothing is binary in the market it's all probability based like mentioned in the first episode right so here the question becomes do we first reach for this fair value Gap or do we first reach for this draw on liquidity right there previous months low well now we need to understand the lower time frame because the lower
time frame and we can already see it in this monthly candle is not showing any signs of rejecting lower already right so on the weekly what do we see on the weekly we have this weekly Fair Val Gap sitting right there which we came into we also had the overlapping part right there and once we came into that we first saw a nice rejection as in this candle on the weekly time frame is rejecting very nicely simply because we are having that large Wick right which for us would indicate that we want to continue lower
already so what would you expect on the next candle the next candle based on the recent candle based on the recent fairi gaps based on that Breakaway Gap we could already expect lower prices on the next candle which simply said does not happen so the lower time frame and with lower time frame here I'm referring to the weekly relatively seen to the monthly the weekly is not showing signs currently that we already want to continue lower right here because if we went lower we should have already continued lower right there and we should have at
least closed in this potential fair value Gap because now we also have a bullish Fair Val supporting the ID so understanding that is also understanding that the first draw on liquidity right here was the previous week high the second draw on liquidity is this swing high on the weekly then the next draw on liquidity becomes the body right there of the weekly then the next draw on liquidity is the monthly fair value Gap sitting right there and at every single draw on liquidity at the previous week high at the swing high at the order block
again right there we have to see how we actually react right there because if we get the same candle with a long Wick something long lines of this then then we can confidently say we are indeed respecting those premium rates and we can still continue lower and this is exactly how the lower time frame is playing a supporting role in understanding the Breakaway gaps and the fair value gaps which of course is also what we went over in the second episode The relativity Theory everything has to be in context with each other then from section
four we are moving on to the last section which is the narrative because if we understand bias and we understand the direction we understand the draw on liquidity then how can we actually deliver Source those draw on liquidities we need another PD array to trade towards that drawn liquidity right in order for us to actually take an entry so the first step is how are we getting there which can also be seen as if we are going higher where are we going higher from if we are going lower where are we going lower from then
the second step in narrative is PD and context these is all things we are going to go over in the next few videos the bias is a first step in a trading plan and it's a first step in order to get to an overall trade ID if you are looking at a pair or you are looking at an instrument and you cannot confidently say what the bias is then most likely it is just low probability and you need to stay out the market a bias is never forced it comes very natural and of course I
can understand it takes practice that is why we have the money-making team where you can be with likeminded people but that is also why we have the YouTube live streams where we go over Sunday weekly forecast every single Sunday showing you how to do this in the exact same steps so feel free to reach out to info@ rio. if you do have questions about the moneymaking team and feel free to also join of course the free live stream on YouTube on Sunday 8:30 a.m. New York local time all right perfect thank you