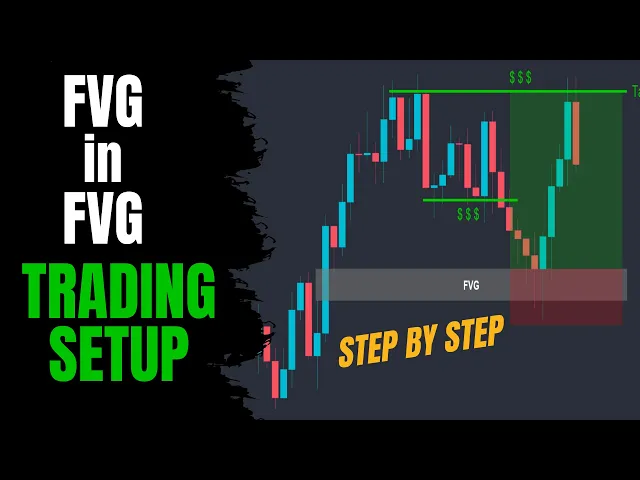
Hey guys, welcome back to another episode. In this video, we will show you one of our advanced entry strategies which we have developed using smart money techniques. We call this trading setup fair value gap.
In fair value gap, we're going to go very in-depth into smart money concepts in this video. So here is what we are covering today. We will show you step by step how to fully apply this trading setup on any chart with all the mechanical rules that need to be followed.
If learning smart money concepts, strategies, entry reasons, and how to stay disciplined with the trading plan interests you, make sure to hit the like button to show your support and subscribe to our channel if you're new. See you after the intro and disclaimer. [Music] [Applause] [Music] Before we start, here are two important points about this trading setup.
Everything we discuss in this video can be used for currency trading, stock trading, and crypto because price action remains fairly consistent across different markets. Second, make sure to fully understand all of the steps we will explain for this trading setup before starting to back test or trade it on the chart because this trading plan is a systematic method that takes into consideration multiple trading concepts for achieving the highest accuracy. Now, let's get started.
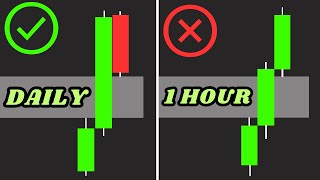
Starting with the basics, what is the fair value gap? Essentially, the fair value gap refers to the space between the wicks of three consecutive candles on a price chart. No matter the candle's color, in the bullish scenario, when the upper wick of the first candle does not overlap with the lower wick of the third candle, we mark this area as the FVG.
Now, what does it signify in terms of price action? It shows a buyside imbalance where the buying pressure has significantly outweighed the selling pressure, possibly due to institutional activities. Now the market has entered a phase of inefficiency which usually leads it to return to the fair value gap area to patch them over.
The buyside imbalance equals sellside inefficiency and the sellside imbalance equals buyside inefficiency. If you are a smart money trader, identifying the fair value gap should be one of the first things you do when you open the trading chart and your eyes must jump right to it. But why do we even need to identify fair value gap areas on the chart?
The fair value gap tells us that big players have participated in the market and impacted the price. The market usually comes back to these spots to grab any leftover orders, which might give us a trading opportunity, but only if there are still orders left. Here on the Euro Dollar 1 hour chart, we have a bearish trend.
The latest impulsive move has started somewhere around here, all the way down to here. We had a sellside imbalance which is signified by these large candles that left the fair value gap areas behind. Now that the price is buyside inefficient, it needs to return to the fair value gap areas to patch them over which possibly provides us a trading opportunity.
Again, we have a sharp move to the downside which created a fair value gap area. Then price makes a pullback to this area, rejects the FVG, and continues pushing downwards. We can apply this concept to all of the time frames.
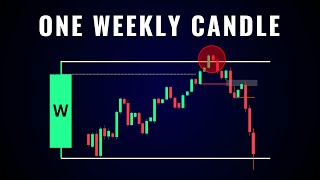
Even if you look at the daily or weekly time frame, you will see that price also makes FVG areas. Here on the Euro Dollar daily time frame, we have a gap area between the lowest price that traded during this day and the highest price traded during this one. This area is created due to the massive selling pressure and only downside price action during the middle day.
So we expect the price to eventually trade back up into that gap zone and that's the nature of the fair value gap. Now if you are a day trader, you will notice that this daily area is a large zone to look for trading opportunities. So that's when the concept of refining the fair value gap area comes in.
Refining the fair value gap area involves scaling down to a shorter time frame to identify the fair value gap within that specific zone. For example, if we zoom into one time frame lower, which is the 4 hours chart, we can see that we have a fair value gap area in that time frame as well. Although our FVG area did not get any smaller this time, we have identified a zone where the daily and 4 hours fair value gap overlap, which makes it a powerful area to look for short entries.
Now, this refining method is not limited to fair value gaps. You can use it to refine order blocks, supply and demand areas, etc. When important news comes out in the forex market and other price charts, it can cause sudden and big price changes, creating fair value gaps.
To handle this, traders should be careful during major news events, securing some profits to limit potential losses, and being mindful of slippage where the price may change more than expected. It's also smart for traders to stay informed about upcoming economic news and stick to a riskmanagement plan to reduce the risks linked to these fair value gaps caused by news releases. If you're curious about how we stay updated on financial news and fundamental analysis, well, we rely on Fast Bull, one of the best trading websites with various useful trading tools.
This site provides one of the most accurate and detailed economic calendar, a tool we use every day before starting our technical analysis. 247 economic live streaming also allows us to stay informed about the latest trading world's news and fundamental analysis. So, if you want to benefit from multiple trading tools that can significantly improve your trading, make sure to check the link in the description.
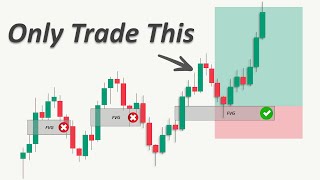
Now, we reach the next important topic. Which fair value gap to choose? Here these are fair value gap areas marked on the chart.
The idea is to wait for the price to enter these zones and look for buying opportunities. However, we are only interested in these two areas. Now, why we are not interested in the first zone?
The reason is if we consider here the start and here the end of the latest impulsive move and apply the retracement tool, these two areas are located below the 50% level which is the discount zone. And this FVG is located above the 50% level which is the premium side of the range. So we are only interested in buys in the discount zone due to multiple reasons.
Usually the market loves to take out the early buyers. So a more conservative way to enter the long trade is to wait for the price to enter the discount. This increases the chance of success and reduces the chance of being the victim of a liquidity grab.
Here in the bearish scenario, we have two fair value gap areas. So basically the idea is to wait for the price to pull back to these zones and enter the short trade. But if we apply the Fibonacci retracement tool, we will notice that this imbalance area is located in the premium and this one is located in the discount.
So as I mentioned earlier, we are only interested in selling in the premium side of the range. So this will be a solid area to look for short setups. This is a more conservative way to enter the trades which also results in a higher risk-to-reward ratio.
It works best when the market is making deep retracements. But if we are witnessing an aggressive trend, selling on the discount side of the range can also be profitable. However, the important point here is that you're not going to win every single trade, even if you only take highquality setups.
Sometimes the market has different opinions. Even with a 30% win rate, you can be profitable as long as you have a solid risk management plan. You can't control the outcome of a single trade, but you can control the outcome of the overall good riskmanagement plan.
As long as you take the highquality setups and stick to your rules, you will be fine. And actually, you don't need to win every single trade. And that's how you become emotionless to the losses.
Now with all being said, let's continue with the second part of this video, which is a fair value gap trading setup. This trading plan consists of two major time frames. First, we have a higher time frame in which we will do most of our general analysis.
We will read the market structure to find the direction key levels, liquidity areas, and more importantly, fair value gaps, which are the optimal trading zones that might potentially provide us with a highquality trading setup. In the second part, we will zoom into our lower time frame to find confirmation and enter the positions. Remember that this trading plan is not limited to any chart or time frames.
However, your entry time frame must be two times lower than your higher time frame. Here are three time frame combinations that you can use to apply this trading strategy based on your trading style. For example, if your higher time frame is the 4hour chart, you need to zoom in 15 minutes to execute the trade.
Now we have simplified this trading plan into two major steps. So let's start with the first one. Analyzing the market structure in the higher time frame.
In this general analysis, we implement the market structure concepts of smart money to the chart to simply find the market direction and key levels. To identify the market direction, we simply spot the break of structures, change of characters, and reversal liquidity sweep patterns on the chart. Now here on the candlestick chart we have multiple breaks of structures to the upside which shows that our direction is bullish.
Then the market made a reversal liquidity sweep pattern above the previous high which signals that a possible reversal is coming. This reversal later is confirmed if we get a break and close below this low. This is called a change of character which shows that the buyers have failed to push the price higher and the sellers are now in control.
In the bullish scenario, the change of character happens when the price trades below the lowest point for two consecutive highs. Then the price is more likely to reverse, especially if it was in a long-term uptrend. Now remember, if you can't clearly identify the market direction in a specific time frame, it is better to move on to the next pair.
Because unclear market direction in a specific time frame increases the risk of making uninformed trading decisions. Moving on to the next pair allows traders to focus on opportunities where the trend is more apparent, promoting better decision-m and risk management. The second thing we look for in the higher time frame is the key levels.
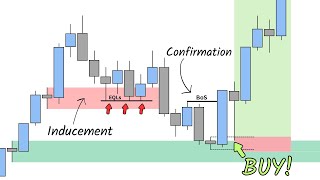
We identify the key levels for two primary reasons. Identifying the liquidity areas and potential reversal points that are our higher time frame targets. When analyzing the chart, we consider the traditional support and resistance levels as liquidity areas, especially equal highs and lows or multiple rejections which are considered critical liquidity zones.
Now, why do we even need to identify liquidity areas on the chart? Liquidity is a key factor influencing price movements. The important thing to know is that the market tends to move towards the level that contains the liquidity.
On the contrary, the market tends to move away from the level that recently has been liquidity swept. With all being said, grabbing the liquidity before reaching an optimal trading area is another confirmation for the price to make the movements we want to see in the market. These key areas might also reject the price a significant amount.
So, we would like to make sure that we have saved some profits before tapping into them. Also always pay attention to how much space we have before reaching an important zone in front of the price because we want to make sure that entering a trade with a reasonable risk-to-reward ratio. The last step in analyzing the market structure in the higher time frame is to identify fair value gaps which are going to be our trading zones.
But as we mentioned earlier, after identifying the FVG zones, we use the Fibonacci retracement levels to identify the location of the zone. If we are bullish, we are only interested in the fair value gaps that are located in the discount zone. And if we are bearish, we are interested in the fair value gaps that are located on the premium side of the range.
Now, after identifying our optimal trading zone, we wait for the price to tap into that area and zoom into a lower time frame to look for reversal confirmations and execute long trades. This is the general idea. This is the checklist of concepts we apply on the higher time frame.
Now the second step of this trading plan is to look for confirmations and execute the trade in the lower time frame. After waiting for the price to enter our trading zone, we need to see some form of confirmation to show that this short-term downtrend is over and the price can push to the upside. To identify this reversal, we pay attention to liquidity sweep patterns and changes in character.
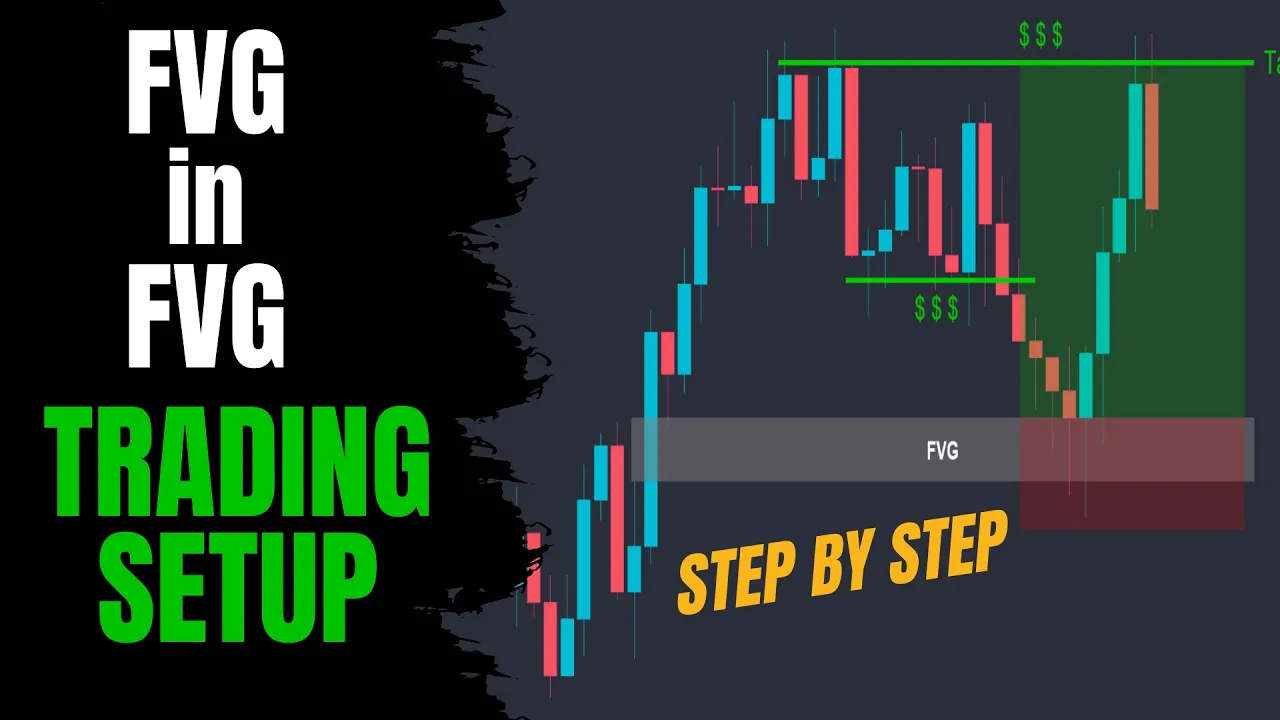
A valid liquidity sweep below this low shows that a possible reversal is coming. And if the price breaks above this high, we have a valid change of character. After the reversal is confirmed, here is how we execute the trading setup.
We wait for the price to create fair value gaps. That's why this strategy is called FVG and FVG. However, it does not mean that the lower time frame gap should be inside the higher time frame gap area.
After spotting FVG areas in the lower time frame, we set our buy limit at the start of the FVG zone at put our stop below. For the first target, we make our trade break even by closing half our position when the price reaches our 1 to2 target. The next target will be the first important zone in front of the price in the higher time frame.
Now, before getting into some real chart examples, I want to explain some common scenarios that happen on the chart and how to handle them. In the first scenario, we have a very tiny area of fair value gap. When this scenario occurs, you need to consider a large zone as your stop loss because we want our stop to be protected from the market fluctuations.
In the contrary scenario, we have a large FVG zone in the lower time frame. Here the problem is that if we set our stop below this zone, we'll have a large stop-loss. So, we either can take a smaller zone below the FVG area as our stop or we can set our buy order in the middle of the zone.
This way our risk-to-reward ratio will significantly improve if we end up winning. This is the checklist of concepts we apply on the lower time frame. Now let's see some examples on the real chart.
Here on the Euro Dollar 1 hour chart, we had a moving downtrend until we got a liquidity sweep pattern and a change of character. Both of them signal that the sellers are no longer in control and our direction is bullish. Now here we can identify two fair value gap areas but only the one on the premium side of the range is considered as the potential trading area.
Now in the next step we simply wait for the price to enter our FVG area and zoom into a lower time frame to look for trading opportunities to go long. Here on the 5 minutes chart, we can see that the price has made a change of character by breaking above this line, which is our reversal signal. So, we spot a new FVG area on the 5 minutes and put our buy order at the beginning of the zone and our stop below it.
Our long-term target will be the next important zone in front of the price. Let's see what will happen. Here on the gold 1 hour chart, we have a moving downtrend.
We have two areas of fair value gap which could be a potential trading opportunity to go short. But if we apply the retracement tool, we can see that only this zone is valid for us. So we wait for the price to return to this area and zoom into a lower time frame to execute the trade.
Here on the 5-minut chart, we have a change of character and a fair value gap area. So we will place a sell order at the beginning of the FVG zone and place our stop above it. Now let's see what will happen.
Now as you can see we have a losing trade. This is the reality of the market. No matter how good your trading plan is, you will witness many losing trades.
And it does not necessarily mean that there was something wrong with your analysis. But the key point here is that you should write down your rules and always follow them. Also, as long as you follow your riskmanagement plan, you will absolutely be fine.
So guys, that's it for this video. I hope this video provided value to you. If it did, please go ahead and smash the like button to show your support.
And if you're new here, consider subscribing to our channel. See you in the next episode.