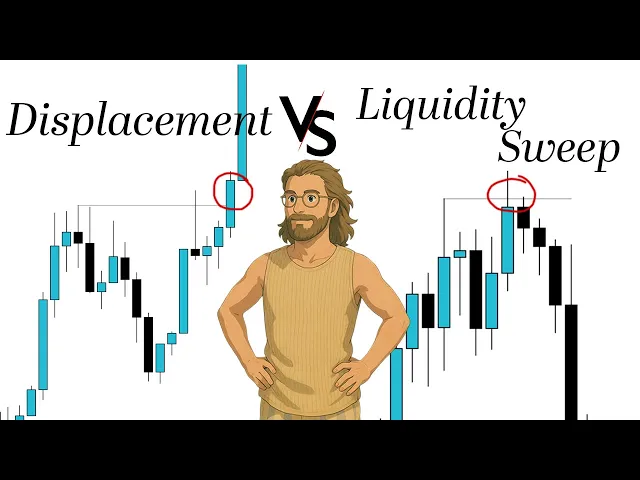
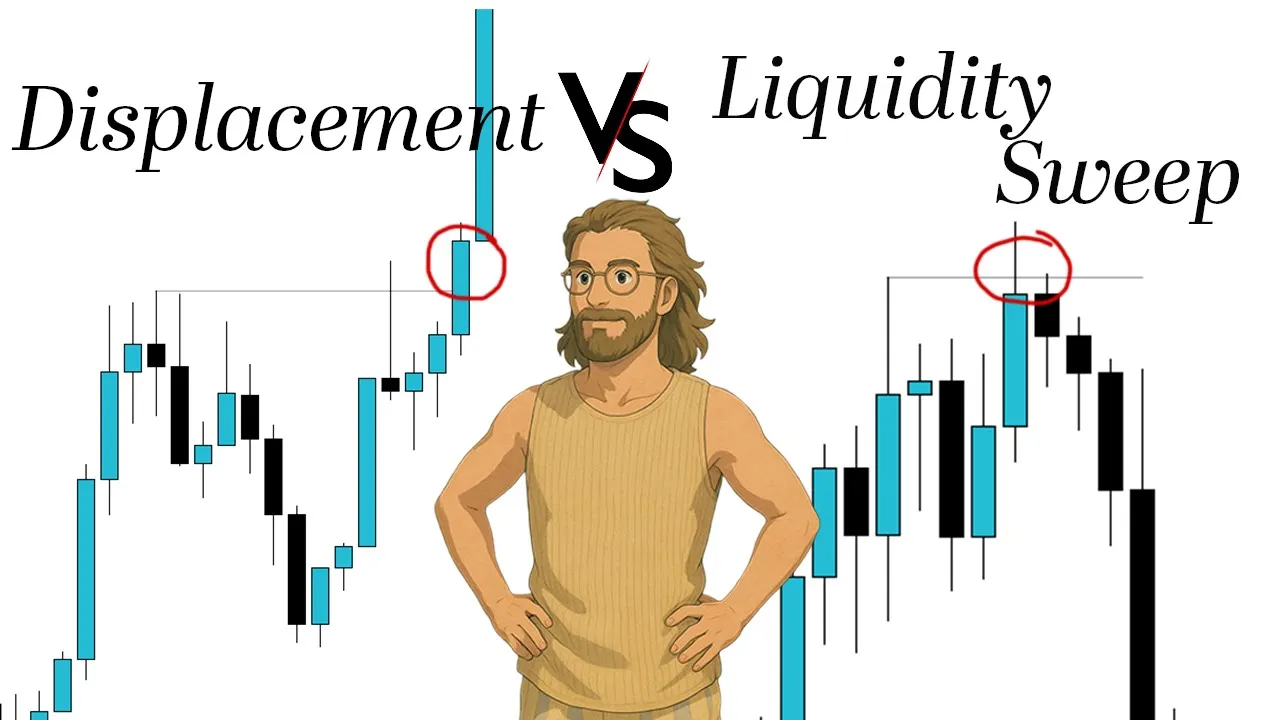
Sweeps versus displacements. Probably the most important core concept in your trading because you are going to understand whether something's going to continue or the probability is higher for a reversal. And that's exactly what you're going to learn today.
As you know, I have two main trading models in my main toolbox, which is an orb and an ILM. Orb takes advantage of continuation. ILM takes advantage of continuations.
At all times during the market, there's one of two things happening. Prices continuing or prices reversing. It doesn't matter if you're in a ranging or an expansive market.
One of those things is happening. And the idea of sweeping or displacing a certain level goes handinhand with understanding which of those models you'll use or if price is willing to continue or reverse. Now, this is undoubtedly the hardest thing for me when I was first starting to trade to understand.
I typically thought if price came to a certain level, right, and then like broke out of its low, it was going to continue. I was like, "Oh, it's a breakout. This is it.
Finally, price broke that level and it's time to continue to the downside. " Boy, was I wrong because there is a lot more you need to wait for to get a full comprehensive idea of what price is likely to do. So, in today's video, you are going to learn what a liquidity sweep is, how to determine what it looks like and when it will occur, and you're going to understand what a displacement is, which is how to know price is going to continue away and actually break out or break down from a level.
I really hope you watch this whole video. I'm going to try to make it as short as possible because my last few videos went super viral uh for my channel standards and most of you only watch about half of it. So, I think I have to cut down the videos, make the information more concise, and that's exactly what I plan to do.
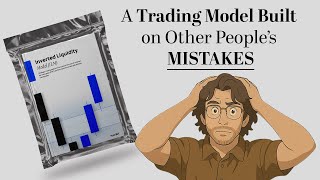
So, I have a whole PDF I've made for you guys in depth learning this entire concept, which will be in the comments below if you want to look at it after. Also, I'll be going through some real examples. Today is April 14th of how I used this ideology of sweeps or displacements to understand that price was going to reverse.
And I can prove to you that I took this live in front of 300 plus people. Um, here's the exact recording. You can see this is pre-trade as I want to retest at this level.
I'm listing out the Asia highs and then we go all the way over here and then you can see the full potential play out of the trade. So, there's that. Um, but let's start out by showing you and teaching you what to expect in this PDF and in this lesson today.
You guys love the previous lesson, so I think I'm just going to continue with this idea of making extremely high quality uh lesson formats so you guys can learn a lot faster than it took me. So first things first, we need to figure out sweeps versus displacement. A sweep in of its core, right, is just a market move to capture liquidity that's resting at certain price levels, right?
That's it. A sweep is just a market move. We want to find liquidity up there or down below there and then we want to take it so then we can move to another price level after.
Displacement is the opposite, right? It's a significant movement in price that indicates the presence of strong buying or selling. So, it's the strength of that breakout.
Now, this still may be confusing and that's okay. Let's do a full disclosure of what you should expect to learn today. Now, this gu is going to go through a few things, right?
You're going to learn what the liquidity sweep is. You're going to learn what the opposite of it is and how to determine when to find it. And then we're going to put two of them against each other to figure out what type of examples these come from, what type of situations they come from, and how you can actually use it to your benefit in trading.
Because if I just describe what a sweeper displacement is, it doesn't exactly give you any insight on how to make money from it. You're watching this video to increase the amount of money you make from the market. So, I'm going to help you understand how to make more money after you understand these concepts a little bit more.
And of course, examples throughout the entire thing. So the first one we're going to go through is the liquidity sweep which is I think at the moment one of the more popularized models or at least the most popularized concept like a sweep of a level. You sweep Asia low, you sweep New York lows or we take previous day high and then it reverses.
So let's get into it. A liquidity sweep refers to a market's action of targeting and triggering clusters of stop-loss orders which are typically placed by traders at key levels such as recent highs or lows. We all know this especially from my last videos.
This concept is central to understanding how the market seeks out liquidity. That's a huge part of this, right? Uh sweeps and displacement is seeking liquidity to then do something with it once it has it, which is essentially the availability of buy or sell orders at specific price points.
So now you kind of understand what a sweep is. We are hunting out liquidity at a certain price level. Right?
If price is moving up and down and we have a bunch of stop levels up here and price immediately comes up here, we know that at that little level, right, as soon as price comes and take these highs over here, that there's going to be a reaction. We need to determine what types of reactions to expect once the reaction has been found. There's a conclusion of that reaction.
How to then react to make money from it. So, let's learn how to identify and use the sweeps. So, we must identify key levels.
Look for recent highs and lows where stop-loss orders are likely to be placed. Now, it sounds like there's a bit of discretion behind this, correct? There isn't that much discretion.
I'm going to prove to you real quick with a live example. In today's trade I took, all I needed to know was where Asia's high was, like the previous Sunday highs that opened at 300 p. m.
on Sunday Pacific Standard. I knew that at this high, there is going to be a bunch of orders. I just needed to wait for that reaction.
Now, I'm not going to describe this reaction yet because you're going to learn it in a second. Now, after having this reaction, right, the next start is if we know that there's going to be stop-loss orders placed potentially at that level, what is the bias, right? What what happens once we reach and this is the part of understanding your market bias.
If the overall market bias is bullish, a sweep of sell stops below a recent low can be a good buying opportunity. Now, all this means that if price is slowly coming down to a level, right, and let's say we have something like this, we have a bunch of buy stops here. Price sweeps this, that is an opportunity for buyers.
Why? Because everybody was seeking those lows right there. Once they found them, use them.
they're going to have a bunch of extra liquidity available to them to take advantage of. That's when we make our decision if a sweep or displacement's happening because if it's a sweep, we know that they're going to take advantage and buy back those orders, right? There's a bunch of those sell stops.
They're going to sell their positions back into the order book. The order book now has more liquidity than normal. And massive market players want extra liquidity because they can't exactly operate in finite conditions, right?
They can't exactly operate in this range. They have to wait till a massive amount of orders occurs or is sold back to the market so they can have it. Right?
All they're doing is exchanging hands. Your weak hand selling your position, these bigger players are buying it back. And that's the core of most trading concepts now.
The last part, after you understand your market bias, we watch for reactions. Right after the liquidity sweep, observe how price reacts. A strong move in the opposite direction can confirm a sweep.
Now, that sounds discretionary, but I'm going to define it even further soon. So this is a quick example you can see on screen here where you have a bunch of these buy stops. So we definitely know that people would sell this high, people would sell this high and if price trades above it with a harsh move and immediately falls back, these sellers, right, all the sellers up here had their stops taken and then all of the buy positions restarted.
So shorts got back into the market or started selling again and reverse price back to the lows. That would be a sweep. Now the main thing you must understand about a sweep and we'll get into a little bit more of a finite example here.
Right? When price sweeps liquidity, it will fail to displace through an area of liquidity instead of wick it. Right?
This is a sign of respect. Now the respect is defined by this wick. You typically do not want to see price close a body above it.
Right? So if we have this body up here instead, right? The body closes up here.
That's a sign that there's probably going to be a move higher. Now, not always, but typically yes. And that's a probability you're seeking when learning these ideologies.
A sharp move through the highs, right? Here's a sharp move through the high, failing to displace, which means failing to close above. So, we come up, take all of those sell stops, right?
They're sell stops because we're at the high. So, all the shorts have to, sorry, buy stops. Those are buy stops at the highs because all the shorts have to buy back their positions.
And immediately, we fall back down into the range. This is a easy sign of a sweep. Now, I'm going to go into further detail in a second of why this is a reversal setup.
Now, the main course of action you need to take when describing this, right? Is this idea that if you have a sweep, it can be on the minute one time frame, and I'll show you here in this live example, right? We can see that here on the M1, right?
We have price closing above just like I showed you in the previous. You you don't want to see this. However, however, we're on the minute one time frame.
there's not that much value. So, let's move up to the M5. Now, the M5 is showing us specifically that we have two different sets of this is 10-minute time frame here.
Two five minute candles failing to close above. That's a good sign that price is likely to reverse it. All it wanted, all the big boys, all the big banks, all they wanted was for price to move up.
They wanted to take all the buy stops and then reverse price back down. This has probably happened to you a few times where one of your levels or your stop levels gets hit and then it reverses immediately because you were liquidity. Hopefully I can help you not become liquidity anymore with learning this this idea a little bit more.
This isn't a model per se, but it's a idea that you can help implement additional confluence into your already existing trading models. Go to the 15-minute and here is the final confirmation. If 15minute candles are failing to close above a certain level, especially several of them, there's two different ones here.
We know that price wants to go lower. If price fails to close above a level, it is telling you it wants liquidity lower, which inevitably happened in today's example on April 14th, 2025. Now, the opposite side of this is displacement.
What is displacement? Now, displacement is simply going to refer to a significant and energetic price movement that indicates a shift in market structure. This shift in market structure is the opposite of the reversal.
Right? This concept is crucial for identifying potential trading opportunities. Of course, we want to look for energetic moves, which sounds discretionary as it is.
An energetic move is a strong move. And a lot of you are going to say, well, how do I define the strong move? The strong move is going to be defined by identifying fair value gaps after displacement.
Look for fair value gaps as potential entry points. If price is moving through a certain level and it is leaving behind fair value gaps, that is meaning that market orders are the essential of they're the essential engine of that order bucket that time. Which means people are market buying, right?
You get the breakout of this level, people are just market buying, market buy, market buy. They're not limiting. They're pushing the market book.
They're forcing the market book higher and they're forcing people to then sell prices higher if they want because they have enough buying pressure to take over and absorb all of those sellers. Now, the next example will help a lot understand this idea because this is just a bar chart. But remember, use multiple time frames.
As I said, the minute 15, the minute five, and the hourly are going to be your best friend here. Do not worry about displacements on the M1, M2, M3, or anything below that. Now, here is the beautiful reality of a displacement, right?
If price does not respect the area of liquidity and and instead runs through it, we know that a liquidity sweep is not occurring. As I said before, right? In the example right above here, price sweeps.
In this example, price is moving above it, closes outside of the range, and leaves behind a massive gap. This means that there is a bunch of market buyers who decided to push the market book as soon as those that liquidity was taken at that high. So, a nice squeeze of the short stops and then a continuation.
And the continuation is defined by this gap that's left behind. If you're leaving behind this massive of a fair value gap, you're likely to have price trade back into it and continue in that direction. I encourage you to test this in real market environments because it's beautiful when you see it happen.
a fair value gap left behind is a result of displacement. So if price and here's another live example for today, price towards the low of today. I told everybody and you can watch back the recording here.
I'll probably play it on the screen. If price fails to displace these lows, we are most likely going to slow down on this little black gray cloud you see. That's the minute 15 200 EMA.
One of the best indicators in the market for market trend. I said we're probably going to bounce here or stagnate. There is zero chance we come below these lows.
And the one way you can determine if I'm wrong is if price closes below this 200 daily em this 200 EMA on the 15 minute. It never did. As you can see a failure to close here.
Fail multiple failures to close here and one closed to opened but there was no fair value gap left behind. We can look at a whole lot of assets like we can go to Salana I think on the daily time frame. We can see some insane opportunities that happened on these highs.
So sweeps and displacements aren't just on the minute 5 minute 15 and and the hourly, right? We can go to the daily and see that soul was having a difficult difficult time all the way up at $264. We had one 2 three four five different daily candles failed to close above this level indicating to you that there's a high likelihood price is going to reverse from this level.
And inevitably, of course, the price reversed over 52% to the downside. Now, the idea of the displacement is the one that I really want to focus on, right? If price is displacing through lower levels, and we can see this on this exact same chart, right?
We can see as price here, right, displaces, it drops through this level, leaves a gap behind, it then continues to the downside. You do have this one deviation candle on March 3rd, but nonetheless, a continuation to the downside. Typically, we can bring up any asset and immediately find core places of displacement.
Here's one on Bitcoin, which is amazing to see. This one on BTC, right? Here's a live example right here at these lows.
You can even use these lows or these lows. All of them include a displacement. the first set of lows from February 18th, price closes below it, leaves behind a fair value gap, and eventually, I think five or six days later, trades into it, and then continues in the intended direction of the trend.
Trades in and then continues in the intended direction. It's amazing to see what a very simple concept can do for your trading. Let's take this low for example here.
Here's this low. We have price sweeping it once, closing underneath it another time, but no fair value gap, and then again another sweep with a failure to close underneath. Let's go to the weekly, right?
This works on the weekly time frame as well. Here's the lowest point of the trend with multiple. Let's go right here.
Let's remove this one. March 10th, failure for a weekly candle. March 31st, failure for a weekly candle go below.
March April 7th, failure again to close below. What does this indicate? It indicates that price is most likely to move to the upside.
We can do this on literally any asset. And I swear, I really hope you guys finish this video because it's one of the most important concepts for us to truly understand as traders. This is the core barrier to understanding if we can have a continuation of price and should hold our positions longer or close positions because a reversal is eminent.
Let's go back to the guide real quick. I want to now show you a quick differential between these two, right? The liquidity sweep versus displacement.
The definition of liquidity sweep targeting clusters of stop-loss orders at key levels like recent highs or lows in order to reverse. Right? Displacement significant and energetic price movement.
Right? We want to see it energetically moving continuing in one direction. We do not want to see it immediately triggering stops and reversing because that would be liquidity sweep.
Now the identification of a liquidity sweep. key levels. Look for their recent highs and lows.
This is mechanical. Look for recent timebased sessions. You just look for London high, lows, Asia high, lows, New York high lows.
That's it. Very, very simple. Or clusters, which inevitably can be equal highs or relative lows or highs that are close together.
Assess overall market bias in the direction to anticipate the reaction that will happen next. And then observe how price moves after the sweep. Same thing on the opposite side.
Look for a strong convincing price change. The convincing price change is defined by the fair value gap being left behind. And just as I said, here it is.
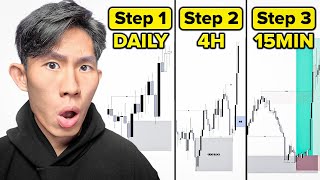
Identify gaps in value post displacement as potential entry points to then continue in that direction. Multiple time frames as I showed you on both liquidity sweep and this confirm the displacement across multiple time frames. I'll go back and show you today's trade again and how I confirmed it on multiple time frames.
We can see that I was looking at Asia highs to be the core of this sweep today. All right, five minute swept, 15-minute swept, hourly swept, price not closing, H4 price swept, and then again you can even see this too. H4 has plenty of candles just giving wicks to the upside and nearly zero displacement.
So a fantastic concept for you to use in your trading toolbox. Now the last thing we need to go through is some of these key indicators. Uh stop-loss clusters, right?
You find the liquidity at clusters where stop losses are likely to be placed. Recent highs and lows, price reaction post sweep is an indication if it is sweep or displacement. Same exact over here.
Strength of the move, fair value gaps post displacement, right? Post price hitting that key level and then consistency across all time frames. What do you do after you've indicated that it's a sweep?
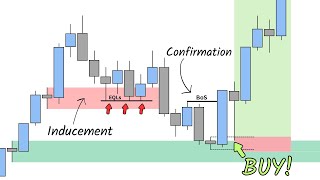
Well, analyze how price action rei reacts post sweep to determine potential trade opportunities, which means use the I L M model for sweeps. Action after you find the continuation model of a displacement, look for a fair value gap to confirm and signal across different charts for trade distance. What to use?
O RB. So, you know, now when you see a liquidity sweep and you see displacement, they are relating to two certain models. If you do not know what ILM or ORB is, it's just my last two videos before this one.
Just look up and that I have on my page, and it completely breaks them down just like I did in this massive example. So, let's end this video off with some more minute examples. These aren't the the best examples, but I want to give you realistic ones.
Of course, I could just show you like a plus perfect examples, but it eventually wouldn't really make sense because you're not always going to have a perfect example in a real market condition. So, let's check this out here. We have resting liquidity above these highs.
We want price to come over to it and we want to see how it reacts. Well, guess what? Failure to close above.
Failure to close above. Failure failure. Again, price is wicking but it's not displacing, showing us that there's a pretty good opportunity that price is going to reverse its course of action and move towards liquidity at these lows, which it inevitably did.
Liquidity resting at the highs, price reaches those liquidity levels respecting the level and not going beyond. Price reverses looking for lower prices. Now, displacement, it's the beauty as well.
Like I told you, we want to look for highs that have clusters. Here's a cluster. One, three, four, right?
Four different highs. If price hits this and we see a nice move outside of it. So you can see as soon as we hit the level we made a fair value gap which means there's a likelihood price will continue because people are buying it at market as it's taking those stops.
So liquidity is immediately being absorbed and we can assume that if price comes into this gap we will continue in that direction. Liquidity resting at the highs reached liquidity level going beyond with ease displacing through it. Price shows the intentions of seeking higher prices.
And there you go. That is sweeps versus displacements. Probably the most important video you'll watch in a while because of how significant it is and how simple understanding it can change a lot of your efficiency in the market.
If you guys want to watch me live trade every single day like I did today on this NASDAQ trade, uh, click the link in the bio for Tuesdays. So, the day after today, actually, I trade for free on Tuesdays and Sundays. Just come watch me, hang out, and I'll do it for free.
Um, we obviously have a premium site where you can watch me do it every day or watch how I perform on my long-term options, my long-term stock portfolio, my long-term crypto. So, I hope to see you guys in there. And, uh, fantastic trade on NASDAQ.
I can see it's already moving to the upside from where we said it was. So, a great session. That is sweeps and displacement.
I'll see you in the next video. Bye-bye.