Hello. Welcome to Byte Size Med. This video is on the waves of an electrocardiogram.
The heart contracts because of impulses that pass through it. Impulses, that get generated in its pacemaker, that's the sinoatrial node. They get conducted through the interatrial pathways reaching the atrial contractile cells and causing depolarization, so that the atria can contract.
From the sinoatrial node, impulses pass to the atrioventricular node and through the atrioventricular bundle into the branches which finally form the Purkinje Fibres. These fibres supply the ventricular contractile cells. So the ventricles depolarize and contract.
The contraction of these chambers follows depolarization of the cells. This is the ventricular action potential. After depolarization, there's initial repolarization of these contractile cells followed by a plateau and then final repolarization, back to the resting membrane potential.
A small portion of these impulses get conducted through tissues and reach the body surface. These get picked up by electrodes and that process is by electrocardiography and the recording is called an electrocardiogram, abbreviated as the ECG or the EKG. Now it's got leads, and the waves would appear differently depending on which lead we're looking at because they look at the heart from different angles.
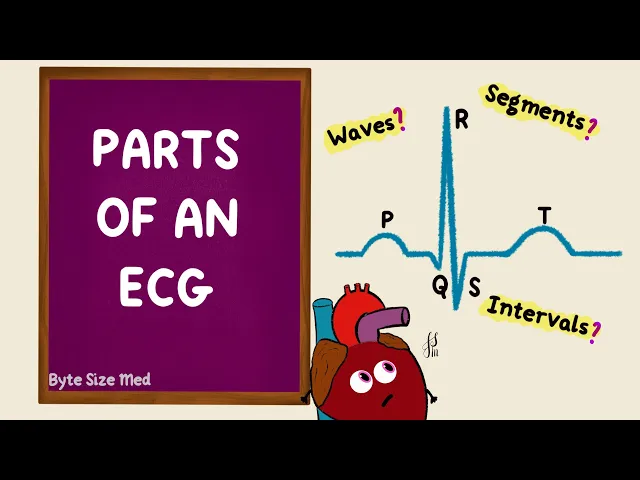
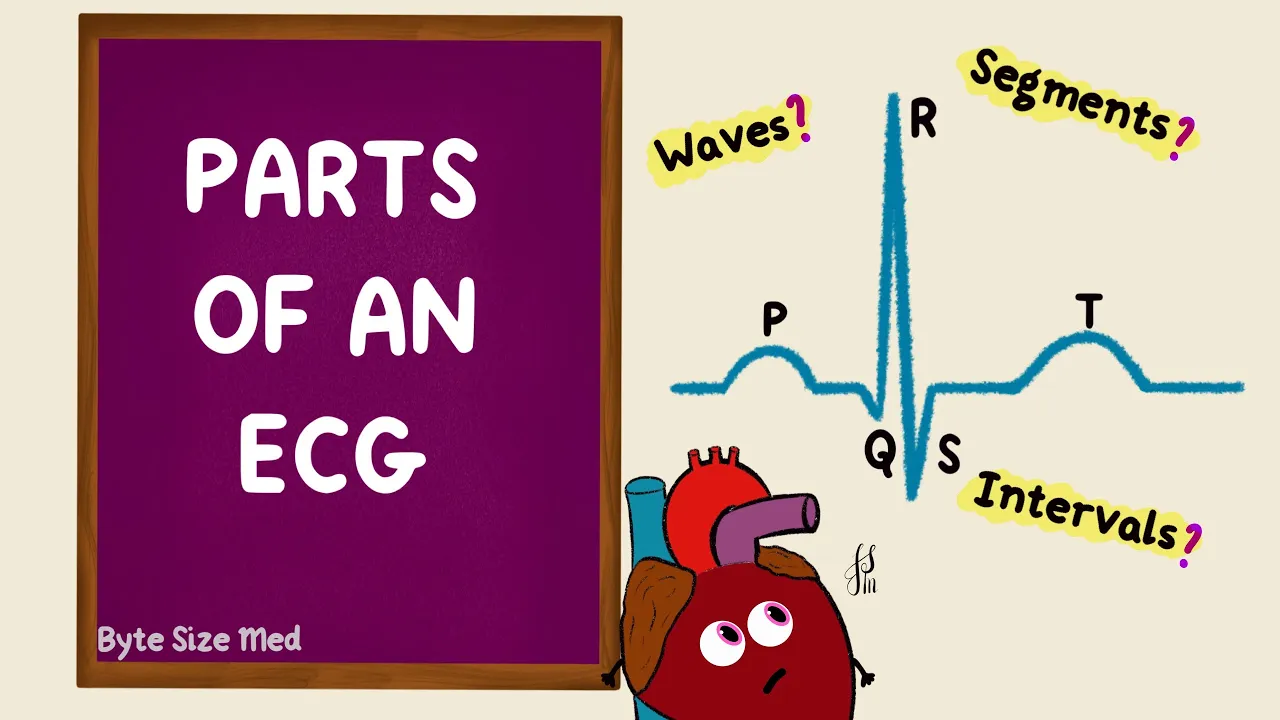
But we use this one to understand what the different parts are. There are waves, segments and intervals. First let's look at the waves.
There are usually five waves in an electrocardiogram. P, Q, R, S and T. Whenever a wave goes above the baseline, it's called a positive deflection.
Below the baseline is a negative deflection. The line itself is isoelectric. Here P, R and T are positive deflections, and Q and S are negative deflections.
But like I said earlier, they might look different in different leads. The P wave represents atrial depolarization. So this wave would happen just prior to the contraction of the atria.
After depolarization, the atria have to repolarize. But there's no wave visible for that, because it gets buried in the QRS complex. Q, R and S are put together as a complex, and that QRS complex represents ventricular depolarization.
From the septum towards the apex and then back up towards the base of the heart. So this QRS complex would happen just before the ventricles contract. Ventricular depolarization is followed by ventricular repolarization.
That repolarization is represented by the T wave. Atrial depolarization followed by ventricular depolarization, and then ventricular repolarization. That's waves P, Q, R, S and T.
In between the waves are segments. There's a PQ segment between the end of the P wave and the beginning of the Q wave. This is from the end of atrial depolarization to the start of ventricular depolarization.
An important segment is the ST segment, between the end of the S wave and the beginning of the T wave. This corresponds to the plateau of the ventricular action potential, because the T wave is repolarization and the QRS complex was ventricular depolarization. This is what the ventricular action potential looks like.
It's got depolarization, a little repolarization, a plateau and repolarization back to the resting membrane potential. This is just for the ventricle. Now action potentials get conducted between the cells of the ventricle.
So on the ECG, the waves are the mean vectors of those depolarization and repolarization waves through the whole ventricle. The QRS complex represents depolarization of the ventricles. The plateau phase is represented by the ST segment and the T wave represents repolarization.
Pathologically segments can get elevated or depressed. When reading about ST segment elevations and depressions and the pathologies that can cause them, you'll come across something called a J point. The J point is the junction between the end of the S wave and the beginning of the ST segment.
Notice that the segments don't include waves. They are in between the waves. So we looked at the waves and the segments in between.
The last thing is intervals. An interval includes a wave and the segment. First up the PQ interval.
Since the Q wave sometimes isn't visible, it's more commonly known as the PR interval. The PQ segment can also be labeled as the PR segment. This PR interval starts from the beginning of the P wave up to the beginning of the Q wave.
So it includes the P wave and the PR segment. That's from the start of atrial depolarization to the start of ventricular depolarization. So its conduction from the sinoatrial node through the atria and to the ventricles.
So this PR interval would include that delay that happens at the atrioventricular node during conduction between the chambers. Then we have the QT interval. That's from the onset of the Q wave to the end of the T wave.
So it's the QRS complex, along with the ST segment, and the T wave. The end of the T wave is the end of ventricular repolarization. So it represents both ventricular depolarization and repolarization, the full ventricular action potential.
The last important interval is the RR interval. This is between one cycle to the next. The time between one R wave to the next this would be the duration of one cardiac cycle.
So it's the length of the cycle. This RR interval can in turn actually be used to calculate the heart rate. But how are all these durations measured?
The paper it's recorded on has a grid. Along the horizontal axis is the time, and along the vertical axis is the voltage. The speed of that paper is typically set to 25 millimeters per second.
So if we assume that there are small and large squares, the large squares have a darker margin. Each small box corresponds to one millimeter. If 25 millimeters is a second, each small square would be 0.
04 seconds. The large square, with five boxes, is 0. 2 seconds.
Vertically, every millimeter is 0. 1 millivolts, which means every 10 small boxes or two large boxes is 1 millivolt. So if we assume a wave looks like this and it's now two and a half small boxes multiplied by 0.
04 would give us a duration of 0. 1 seconds. So that's the duration of this wave.
So using these boxes, the durations of the waves, segments, intervals, and the amplitudes can be calculated. So we have the P, Q, R, S and T waves, the PR segment and the ST segment, the PR interval, the QT interval and the RR interval. Those are the parts of a normal electrocardiogram.
I hope this video was helpful. If it was, you can give it a like and subscribe to my channel. Thanks for watching and I'll see you in the next one!