The Relative Strength Index, or RSI, is an oscillating indicator that is designed to measure a stock’s momentum, which is both the speed and size of price changes. Many investors use this indicator to help identify whether a stock is overbought or oversold. Using this information could help determine potential entry and exit trading signals.
In this video, we’ll discuss how RSI is calculated, how it measures momentum, and how it can potentially help identify trading signals and trend reversals. Let’s start by calculating RSI. First, identify a previous time period to use.
A time period is generally 14 days but can be shorter or longer. Next, add up the average gains and divide by the average losses during your chosen time period. The calculation’s solution, or value, is referred to as relative strength.
The relative strength value is then plotted on a graph between zero and 100. Plotting a line helps investors measure momentum in relative terms, which means looking at the indicator’s current value in relation to past values. This comparison may make it easier to identify when a stock might reverse its prevailing trend.
To identify potential trend changes, there are two ranges of the indicator to keep in mind: overbought and oversold. Overbought refers to a stock that has increased rapidly in a short period of time and may reverse lower. Conversely, oversold refers to a stock that has decreased sharply in a short period of time and may reverse higher.
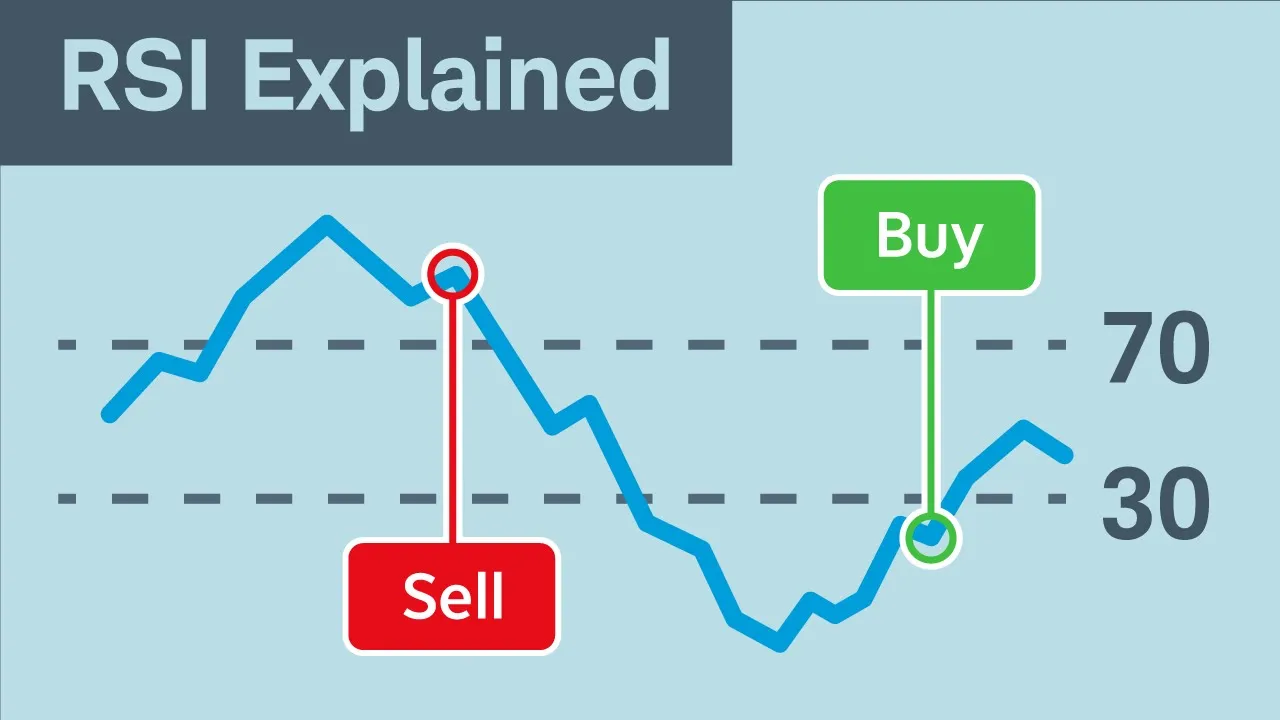
Now that you know how to calculate RSI and how it measures momentum, let’s look at how investors might use this indicator to identify potential trading signals. Some investors define oversold as an RSI value below 30. When RSI crosses back above 30, it generates what some tech traders generally see as a potential bullish entry signal.
Exit signals work the same way except investors use overbought values. Technical traders view an RSI value above 70 as overbought. When RSI crosses back below 70, technicians typically see it as a potential exit signal.
Now that you’ve learned how tech traders might use RSI to determine trading signals, let’s discuss how the indicator can be used to spot potential trend reversals. A trend reversal may be confirmed by the RSI when it shows a divergence. A divergence occurs when a stock’s price moves one way and RSI moves in the opposite direction.
For example, a bullish divergence occurs when a stock makes lower lows, but RSI makes higher lows. This can be a signal that downward momentum is waning, and a bullish reversal may follow. After identifying a bullish divergence, an investor might use a cross back above 30 as an entry signal.
A bearish divergence occurs when a stock shows higher highs, but RSI shows lower highs. This can be a sign that upward momentum is slowing, and a bearish reversal may occur. After spotting a bearish divergence, an investor might use a cross back below 70 as an exit signal.
Using RSI to spot divergences and identify potential oversold and overbought conditions can help investors find potential trading signals. However, this doesn’t mean using RSI is fool proof. One of the main risks of using RSI is its signals aren’t always accurate.
This is because RSI can’t factor in events that influence a stock’s price, such as economic news, earnings, and other fundamental aspects. Additionally, RSI can remain overbought or oversold for long periods of time. So even if a divergence suggests that a stock might move a certain direction, there’s no guarantee.
Reading RSI also requires subjectivity that benefits from hindsight. For this reason, RSI is usually used in conjunction with other forms of confirmation, such as volume and the overall trend in the broader stock market. Even if RSI is imperfect, investors who incorporate the indicator into their trading may find the insights and context it provides to be useful.


![BEST MACD Trading Strategy [86% Win Rate]](https://img.youtube.com/vi/rf_EQvubKlk/mqdefault.jpg)