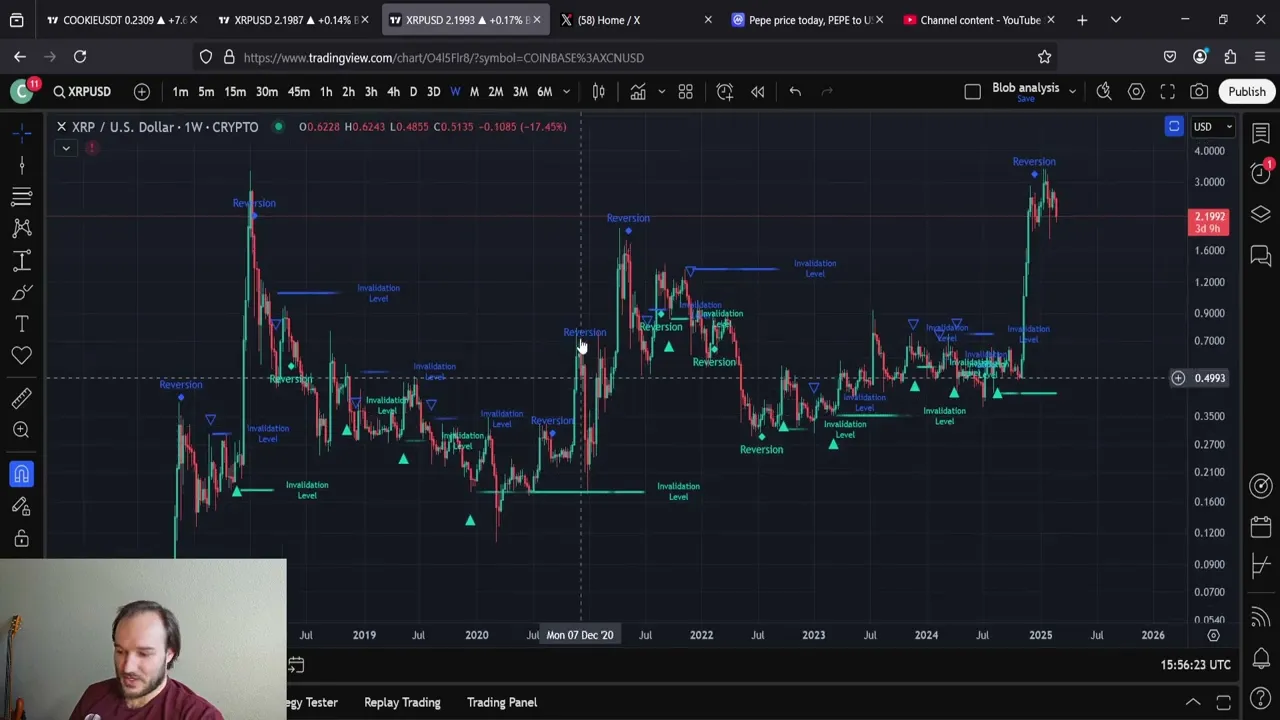
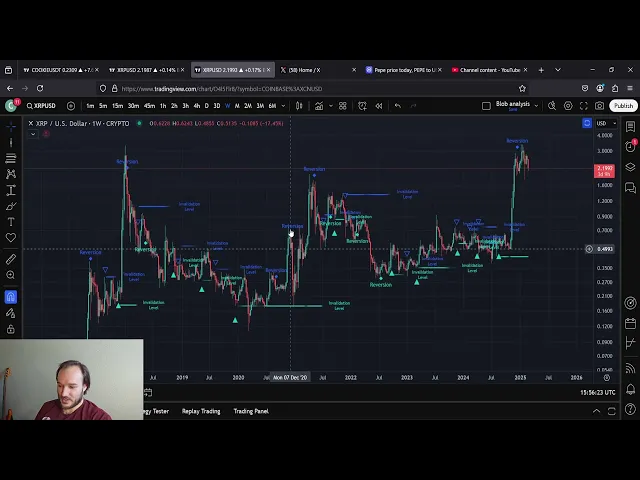
what's going on everybody it's your boy Cesar and we are talking about xrp today hit that like button you guys subscribe if you want to see more content like this and let's get into it I almost said we're talking about lro because that's the indicator here um I wanted to start off because I know that I've mentioned this on a few other videos but I know the xrp xrp community might be wondering what the hell this thing is because I don't I don't think I've brought it up before on an xrp video or if I did it was one time um it's called the lro logarith logarithmic regression oscillator um by chart Prime if you have trading view I think you need premium I'm not not 100% sure but if you have trading View and you go to community community um on your on your indicators here you actually have access to this it's the linear regression oscillator by chart prime chart Prime is the author right um I've seen this this boost going up ever since I've mentioned it so I don't I don't know if if he's gaining popularity but I like this indicator a lot guys it's not it's not that hard to understand right what I love about this indicator real real quick I'll just explain it real quick okay is that everything that you see here you don't even need to look at in the indicator right that's the that's the indicator that's the lro but they apply it to the chart so you can literally see everything except except I guess you don't know when you're in the over bot Zone in the oversold Zone to be completely fair but blue these blue triangles mean you're building bearish momentum the blue lines are invalidation levels so if you're building bearish momentum you're suggested to be in a downtrend if you want to invalidate that you have to break the invalidation level reversions often suggest that your your oscillator here right you can see reversion it's in the overbo zome and statistically speaking you would likely revert back to neutral it doesn't mean that you're going to revert and and go up but generally that is what happens not all the time you can see here reversion reversion reversion after reversion you still just did not go up but uh definitely a lot of reversions in this area on a 1H hour basis I find that the the shorter term time frames tend to be more accurate though this might not be the best example and the way that I look at these invalidation levels are not as like strict lines themselves right you can Wick through them but you generally find resistance or support on them here for example is an invalidation level on the 1 hour time frame that you just Wicked to a little bit through even and you're finding support on it now this is actually a really good look and I assume with these reversions down here with these bullish changes in momentum gaining here right you can see that you are gaining bullish momentum now I guess I guess technically you are losing a little bit of momentum but from here you might you might start gaining um bouncing off of here could be a really good look we're looking to see xrp move above $231 to invalidate the notion of going lower that's all this is saying right if we get above $231 on a closing basis $2 31. 5 then yeah we're we're going to we're done moving lower and we're looking to move higher at least on a 1 hour time frame on a 4-Hour aspect we also got a reversion down at the lows here the invalidation level for this is all the way up at $272 right a little bit little bit steeper but as you get to these more significant time frames you're going to have more significant areas of support and uh resistance reversion down here no reversion here but that's okay just because there's no reversion doesn't mean it's time to sell right or or time to buy um there wasn't a reversion at this top right often times s in double bottom double top scenarios you won't get that that reversion I've noticed with this thing right it's not perfect no indicator is perfect but I feel like it is pretty damn good honestly we're going to look at xrp without it I just wanted to show that that one hour time frame and just explain that indicator because we are I'm going to be using this indicator a lot um just just casually I won't explain it I won't introduce it like I did every single video but um like like I do with the RSI I'm like okay looking at the RSI yeah looks like it wants to go down we got lower highs here we got higher highs there that's bearish Divergence we're right above the 50 maybe we could go down I don't know we've also got this this higher Trend right here from a low point you know and I'm I'm doing all this without explaining what the RSI is or what it does I'm just telling you what I think of it right that's that's how I want it to be with this that's that's all I'm saying right so by the end of this week I actually would expect that xrp pulls up it's probably going to pull it scared up a little bit um I bet 3 days nine hours left yeah you will you will definitely be moving up I think a bounce off of this line would look really nice just because it would look nice and just because it's what I think doesn't mean it has to happen right who cares what I think xrp certainly doesn't give a damn but if it pulls up a little bit if if it closes the the week slightly red but neutral very neutral you you you will get a precise bounce right off of this line so that's that's what I'm expecting I'm expecting that xrp in the next three days nine hours it's down 14. 5% I'm assuming that you pull up being down 14.
5% means you'll go up more than that right let's see because 14% doesn't even get you all the way back up to that high right to get back up to where you opened it's like 18% so I bet you can see a 14% or more move to the upside yeah that makes sense to me by the end of this absolutely that's what I think let's look at the three-day time frame real quick I just I don't know what xrp is playing at here right I really don't know at first we were assuming it was in a bull flag then it was in a pennant it broke out like what are you what are you in are you in some kind of bull flag now it doesn't doesn't seem like a bull flag if it was you would you would keep coming down and it it could happen but if xrp keeps going down the rest of crypto will keep going down and so so the only way to make sense out of that is if if the crypto markets are weak then xrp could go lower and it's possible but I think everything's about to turn around and get real bullish here real soon guys um what do I know I could be wrong um to me other than the potential for a bull flag look right here it kind of actually looks like a diamond top we've been seeing some Diamond tops across the space recently right it kind of actually looks pretty well like a diamond top it's not perfect to me it it looks it looks too spread out to be a diamond top but let's run with it let's run with it to some degree right maybe it's a broadening top and we're reaching down right now for this and broadening tops are notorious for what they call a partial decline partial declines or or partial Rises Rises to it could be either way partial decline is defined as you're reaching for this trend line but as you reach down for it you find support somewhere where it's not on the trend line it looks like you'd reach that trend line but you just don't go down there so then you come up and then you break through often times a a partial rise would indicate that you're going to break out to the downside a partial decline indicates you're going to rip up to the upside here okay so maybe that's what it is I don't know I I don't know what this pattern is to be completely Fair um it's definitely not a head and shoulders pattern if anybody thinks it's a head and shoulders pattern you're wrong it could perform who knows it could perform the same way as a head and shoulders pattern um but but no it's not a head and shoulders pattern but but it is some form of consolidation phase the key areas that we're looking to break out I've already talked about them right so let's let's talk about let's talk about and I also talked about where I think it's going to be by the end of this week so let's talk about where you're going to go afterwards right that's probably most people's favorite Parts if we look at this thing actually I want to look at on a weekly basis too the lro again it's not very useful most of the time on a on a longer term time frames in my in my opinion my genuine most humble opinion it might be good for reversion levels right stuff like that but it's it's less less tradable more more like it's better for swing trades less for day trades on these longer term trades which I I guess guess makes sense to be completely fair look at that reversion here last cycle or or two cycles ago reversion here on the weekly and that was your last cycle High you got a reversion here now could be a could be a cycle ending indicator it's not it's definitely not guys because look you you had reversions back here you had a reversion right there you had you know what I mean it doesn't mean that it's it's going down but definitely called this consolidation phase it absolutely did um very well nothing to really gain from there as far as what we're expecting to the upside I was looking for an invalidation level but I think we've already invalidated it so whatever xrp on a monthly time frame taking our all-time high our current well I guess not our all-time high which we had back there in uh in January but our all-time high from 2017 2018 right there to the to the low of this cycle of of this of this consolidation phase here I wouldn't say xrp what what I would say is that you've already broken out of your multicycle consolidation base you've already broken out of it now you're just resting you broken out you tore right through the 886 and now you're resting above it this is an absurdly bullish phase of consolidation you guys getting above the 886 almost always means that you're going to at least see your extended targets up here these lines up here right the gray line is the 100 level that's what started your retracement right when you get above the 886 you start looking for the extensions okay generally speaking it's once you close it you you see this in a very short amount of time but also generally speaking you don't just shred through everything to get here so in moments like this how however bullish it is you oftentimes do consolidate and if you can consolidate above the 886 like you're doing that's that's great that's really bullish honestly if you consolidate between the 886 and the 786 that's fine too right so even down to the 618 ripping up above the 886 and then coming coming back to the 618 that's fine that's that's great it's very bullish stuff um you could even go lower than that and it would still be fine but this this is definitely the most bullish option that we have with that in mind you have already broken out of your multicycle consolidation phase I think it's very obvious this was the breakout move right very bullish phase of consolidation whatever consolidation phase you want to call this it's a head and shoulders pattern a diamond pattern a bull flag whatever you want to call it it's a consolidation phase um I don't I don't know if any of those are right the closest one that I would guess it' be a diamond pattern but even then I I don't know it's just a consolidation phase I would think in this very bullish phase of consolidation here even after your breakout move you'll be breaking out to new all-time highs in Blue Sky breakout territory price discovery mode with this very bullish phase of consolidation I'm only stepping on a limb here and and gonna guess that you don't stop at your bare minimum Target from your multicycle long consolidation phase I don't I don't think you stop there I think you go there I think you go there but I don't think you stop there right you're at $2. 20 right now $2 if I if it'll let me get on there $2 and it's saying $219 but what whatever $220 right now that would be a 280% move for xrp and I expect this to happen over the next four to eight weeks somewhere in that time frame right end of March beginning middle of April something like that that's what I'm expecting okay maybe end of April it could happen but this move this move here would not be end of March right by the end of March I would actually think we're Above This Target or or may maybe I shouldn't even say that by by the end of the move obviously I think that we're above this target who knows what what the time is you know it could be the end of March that we're at the end of the move and in which case maybe we're at 13 bucks maybe we're at 10 bucks somewhere in between is more likely um you know maybe it's the end of April and we're in that zone right but certainly by the end of March I would expect we are we are in price discovery mode we're likely going to be above $5 if not above $6 we could very well be above 837 but where I think we're going to stop you know nobody knows nobody knows the exact number but where I where I truly believe you're not going to stop is 837 right I want want you to be aware the average crypto if we look at let's do this real quick let's do this I'm going to refresh the page my internet's slow so we might have to talk for a second let's just see man I said that but I had like false hope in my head that that it wouldn't be slow I might just hit my my inhaler Cesar the asmatic oh here we go oh we got to talk about xrp not not xcn and I need to do it before I forget what I was saying come on now baby there we go okay now what was I saying oh yes okay okay I remember so xrp here on this last pump if we look at this here from the low of the month right the low of the move right here right not not the absolute low but just the low of the move to the high of the move you moved up 591 per. and that's that's in January let's just go to December because most coins sto moving up in December 490 per.
okay xrp moved up 490 per. I have a purpose okay I promise you 490 per. this will explain why we're going to see targets above above $8 above $9 a okay this will explain it 490 per.
this is the others chart this is essentially the index for the average altcoin so if this thing moves down 10% it's down 26% right now I would assume the average altcoin is probably down about 26% maybe more maybe less but somewhere in that area right that's that's how we uh we go off of this here that was kind of weird I feel like I went like when I did that I was just taking a breath in and then wiping my my mustache off from from the water but that that was like weird timing low low to high right here uh all the comments are getting Vindicated um low low to high right here right that that high was in December that was 138% move so you understand right in November to December when that we had that last little altcoin rally the average altcoin pumped about 136 138% the average coin did some pumped a little bit more some pumped a little bit less some like xrp pumped 490 instead of 138% okay the same chart I'm expecting personally that the average altcoin in the same time that we're expecting xrp to make its move I'm expecting that the average altcoin interacts with this 1272 area okay that would mean the average altcoin over the course of March and April from from this price now that we're at at the end of February here on the 27th would grow something about 237 per or more but but around there that's the average expectation that I have for the average altcoin I don't know about you guys but to me it doesn't seem like that hard of a conclusion to draw together that if this thing destroyed the altcoin markets it did a 490 per where the average altcoin did 138% in this this last move I would assume that if the average altcoin is going to do a 237 % at least that's what we're deriving from this right you're going to break out to new alltime highs across the space the bull Market's on you're probably going to see a bigger move than what you saw in November December Bitcoin dominance is going to come down lower it's going to be obvious that the dominance has topped off right we could look at that chart too but I'm not going to because I want to end this video damn it 237 per. I don't think it's any small conclusion to believe that you're going to see something dramatically higher than that right 283 per.













![[Brasil] Pokémon Presents | 27.02.2025](https://img.youtube.com/vi/-n-sxzh_mPk/maxresdefault.jpg)