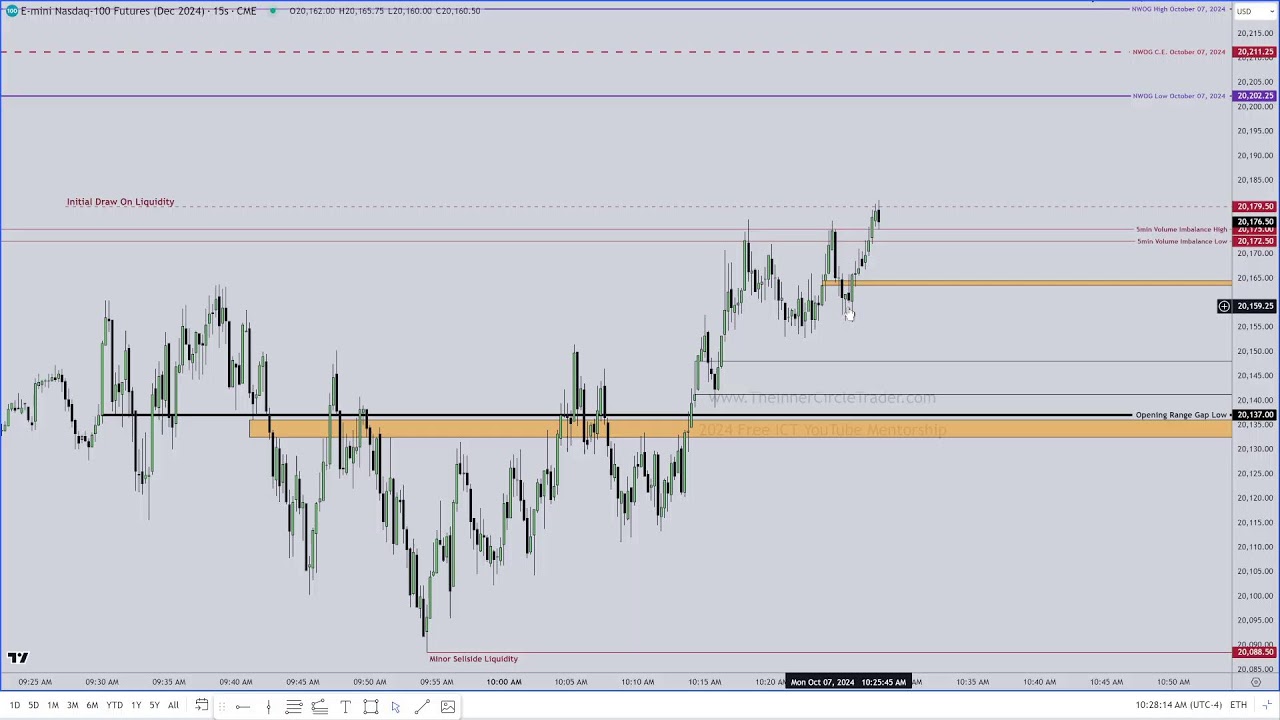
hello there I hope that you are doing well during today's lecture I will discuss stepa and time Cycles with you understanding time-based price delivery in financial markets before we begin with today's lecture I just want to share with you that during the prior lecture there was an editing error made prior to the release of that lecture therefore there was an issue with the visibility of the charts but luckily it will be solved for this lecture and therefore you will experience no official issues whilst watching this lecture so with that being said I want to advise you to take some time to watch this lecture because I have a lot of things to share with you when it comes to time and price and these Concepts will be the first time that you will hear them out there so therefore buckle up and prepare yourself for advanced time Concepts to be introduced to you here we're on the early chart of Nest DEQ and what I want you to see on this early chart of nesc is the fing I want you to see that on the right right here we can see that the NASDAQ expanded towards the upside and it traded into this small little CB right here when it traded into this small little CB right here I want you to see that the market began rejecting that CB right here Market begin consolidating in what did the market consolidate initially inside of that CB what occurred afterwards we saw the market drop lower trading into this imbalance right here this bullish for fire gap we saw the market then run up higher taking out buy Equity right here what I will share with you is that this move higher right here was anticipated based on time and price in advance of the 9:30 open I shared with my mentorship students that as long as this BC would function as important price I would anticipate higher prices if I did not say that and you're a mentorship student of mine please go out there in the comment section and share with the public students that I did not call this move exactly in advance and I did not share that if we would not this place below this busy then we would anticipate higher [Music] prices I've asked about you and they told me things my mind didn't change I still feel the same a life with no fun don't be so ashamed you know you like I will my only wish is I die real cuz that truth hurts and those lies still and you can't sleep thinking that he Li still so you cry still te all in the pillow big girl dog get a little T off pushing me away so I give a space off dealing with a heart that I didn't break I'll be there for you I was there for you you I keep thinking you just don't know trying to run from that say you down with that on your face girl it this don't show when you're ready just say you're ready when all the bag is just ain't is happy and the part's over just don't forget me we'll change the place and we'll juston never have to worry you won't ever have to hide you'll SE all my Mist so above me in my heart you let me here is what I'll do I'll take care of you [Music] [Music] this is my birthday I get high if I want to can't Den not that I want you but I lie if I have cuz you don't say you love me to your friends when they ask me even though we both know that you do you one time in love one time you and all your girls in the club one time also convinced that you're following your heart CU your mind don't control what it does sometimes we all have our night don't be so ashamed I had mine you've had yours we know we you Ain being alone you ain't the only one you hate the fact that you walk the dream when they Soldier on and you love your friends with somebody should have told you so save you and stud you won't ever have to worry you won't ever have to hide and you'll seen all my mistakes so love me in my cuz if you let me here's what I'll do I'll take care of you [Music] i' L and I've lost I want [Music] n [Music] you have just watch the recording of me taking the trade on the low right here of NASDAQ I nearly captured the absolute low of today and that right there was a very clean long opportunity what I want you to do is I want you to pause the lecture for a moment and I want you to try and basically annotate for yourself in your mind or maybe can make a screenshot of this lecture and try and annotate as best as possible what you see in the delivery of Price Right Here pay attention to the bigger time based ranges that would be my advice when studying this delivery I know some of you don't want to pause recordings and don't want to pause Rees because you think that somehow you are not supposed to take the time to study for yourself and that everything should just be handed to you well let me tell you something if you think that you can just watch recordings like this and you can gain the most benefits of them by just watching through them and just treating them like it's some type of movie show that you're watching well let me let me tell you something that's not how this stuff works you really need to think for yourself and then you need to see whether or not your thought processes are aligned with what I'm about to share with you so I hope that you pause the recording because I'm going to add my lipstick to the Chart now what I want you to see is the fing I have annotated two specific price levels the previous week's high right here this high and I annotate the previous day high as outlined this previous day high formed inside of this RCB right here what I want you to see is that after the previous day high formed the market Consolidated we then dropped towards the downside and we traded into this blue shaded box this bullish R fire gap or BC what I need you to understand is that during the current weekly delivery we always refer to the previous week's High and the previous week's low in order for the orderflow to remain bullish the moment that we trade above the previous week's High what we need to see Ur is that that previous week's High has to function as support on price if that previous week's high does not function as support on price that right there is a warning sign to us that the underlying or the flow might be changing but here comes the thing have you ever wondered why your true support turn resistance idas or your resistance turn support IDs sometimes work and sometimes they don't if you investigate the times that true support turns resistance or true resistance turn support Works what you need to see is the fling you need to see an imbalance trade through that specific high that old resistance level so to say and then you can anticipate that that high which is time based is likely going to function as report on price if it does not function as report on price it means that the underlying order for has changed from bullish to bearish but as long as the market retraces into that previous week's High into that time based liquidity pool that was initially or Target during this run higher you need to understand that we must see this imbalance function as support on price therefore we can anticipate continuation to take place the moment that we see CPI right here on Thursday drop lower here's the thing guys CPI took place on Thursday what did CPR do the initially ran up higher and then immediately manipulated towards a downside what I want you to understand is that that right there shows to you that news gets utilized for manipulation purposes every every single Romine Trader will have looked at the CPI lease and think to themselves well you know what CPI was pretty bearish the market dropped significantly afterwards I should go short for today the high of the week is already in and we're going to go lower for the remainder of the week that's the top process however we know that we have relatively equal highs right here and we know that the market doesn't like to leave those relative vehicle highs intact we see the market drop lower into the lower of that imbalance into the previous week's high and we then see the market defensely begin to reprise towards upside aggressively drawing towards buy side security this was a low resistance security run once the time was right now what I will do is the f I will zoom in with you into the delivery of price when it came to the imbalance on Wednesday and Thursday's delivery what I've done here is I've annotated the times of very specific candles I've annotated the 9:00 candle the 9 M candle of Wednesday and the 9:00 candle of Thursday and I've annotated the 10:00 candle of Wednesday and the 10:00 candle of Thursday the reason why I'm doing this is because I want to show to you how time and price were aligned inside of this delivery what I want you to see is that at 10:00 this imbalance this bullish forol Gap was formed it displaced through Tuesday high and through the previous week's High what we can see is that the market retraced into that imbalance on the day of Wednesday during the afternoon session with the f1c minutes we saw the market run up higher creating the high of day on Wednesday here Market goes sideways and it drops lower aggressively until the morning session the morning session comes along and what do we see we see that the 9:00 candle right here drops lower trading into the lower end of this RBC it just falls short of trading into the high of the previous day 9:00 right here but that right there doesn't matter why not because you need to understand that as long as that 9: candle does not displace below that previous 9: candle and it doesn't trade below that previous 9: candle it means that we can anticipate that the underlying order flow is likely going to continue to be bullish what do we see 10 a opens up right here it drops lower right here into that old 10:00 price range of that imbalance and it immediately begins to run away what have I just outlined to you try and think for yourself about what I just outlined to you I've just outlined to you how you can use a very specific time based range based on an hourly chart in this case can use whatever time frame you like but how you can use a very specific time based range to gou order pH what I want you to understand is the following based on that 9:00 range right here from Wednesday you can see that that was the low of that sequence of three candles which set up the creation of this early in Balance right here as long as this 9:00 candle does not trade below this low I anticipate higher prices 10:00 comes along 10:00 reprices away from that previous 10:00 imbalance guys are you beginning to see how we can utilize very specific time based ranges to analyze these markets and to see what's like going to happen next if we then drop into the 50-minute chart what I want you to see is the FL aren't you to see that we drop lower during the CPR relase but we have these relatively equal highs that have been created that is engineered by set Equity we drop into that early imbalance and we can see that 9:30 comes along 9:30 initially consolidates but eventually we see the market run lower during our maret window we take out sells at quity resting below this low and we nearly reach the low of that early imbalance we just fall short of it we see the market then begin to show the signatures of wanting to reprise higher and we trade into the low of this down close Scandal that right there is already a very clean opportunity why because we nearly delivered more than 100 points within just a matter of around 15 to 20 minutes think about that for a moment within 15 20 minutes you would have been able to capture more than 100 points I don't know where you're from but capturing so many points within such a short period of time is my opinion very good and if you're saying that that is not enough then you really need to rethink what you deem to be good and what you deem to be just regular now if we pay attention to the one minute chart I'm going to walk you through this delivery right here based on time Cycles what you can see is the foing I've put a vertical line at 8:30 a. m. at 10:00 a.
m. and at 11:30 a. m.
right in front of you you can see the morning session from 8:30 a. m. from 8:30 a.
m. we are looking at the morning session for the second and third cycle for that morning session meaning I do not look at the first morning cycle from 78 to 8:30 a. m.
inside of this delivery all I care about is from 8:30 to 11:30 a. m. for this breakdown what I want you to see is that in that window from 8:30 a.
m. to to 10:00 a. m.
I've divided that time cycle of 90 minutes into three smaller 30 minute Cycles meaning the first 30 minute cycle being from 8:30 to 9 the second 30 minute cycle being from 9 to 9:30 a. m. and the third 30 minute cycle being from 9:30 to 10:00 a.
m. what I want you to see is that the first 30 minute cycle of this large 90 minute cycle has to CPR release at the beginning of that cycle of course and what do we see we see the market initially expand towards the downside trading into that early imbalance into the previous week's high and we see the market form a low there we retrace and time Distortion begins to take place where the market simply begins to move sideways I do not look at any of this delivery meaning I try to skip through all of this delivery when I look at the charts what I pay attention to is what is 930 doing 930 initially drops lower and we then see the market reprise High the market begins to consolidate and we see the market begin to slam lower during the beginning of our micro window from 945 a. m.
to 10:15 a. m. this drop lower makes the market trade below the low which formed between 8:30 to 9:00 a.
m. that first 30 minute cycle at 9:15 a. m.
we come in very close proximity to the low of the r inbalance but we just fall short of it as you can see but we can see the market begin to reprise towards the upside it closes aggressively Above This upco scandle this upco scandle was the low of that first 30 minute cycle what do we see the market retraces into that upcast scandle into the previous weeks high and this is where it went WR the market expands away from this upcast candle from this gray box we see the market trade above that already imbalance and we see a BC get created at 10: we can see that the market begins to reprice away from that one minute in balance and we consolidate in advance of this buy set grity pool of this relative vehicle highs that formed shortly after the 9:30 open what I want you to see is that we take out those relative vehicle highs creating a new high for the regular training hours and we drop lower once more coming in close proximity to my trail stop which was below this low the market trades below the 9:30 open price once more before it reprices towards the upside trading into this one minute CB which formed at 8:30 a. m. when this CB was reached I took another partial and then I shared with my mentorship students that I had to see this imbalance function as support and price if this imbalance would not function as support price then I would want to get out why because even though the higher time from order for might still be bullish I did not want to sit through a high resistance great run meaning I do not want to sit through all this back and forth price action I want to be in when the market is primed to expand and I want to be out when the time is not right anymore for AO Sy security want to take place eventually the market runs up higher and during the launch cycle from 11:30 a.
m. to 1: p. m.
the market reaches the CPI by security pool and the previous day high this right here is a very advanced level of understanding timer price and if you do not understand everything that I just discussed I would highly advise you to re listen to it to make it click for yourself and just keep on watching it until it clicks because when it clicks you are going to see that I've just literally showed to you the application of time Cycles from a weekly cycle all the way to a 30 minute cycle and I could even drop into a 10-minute cycle but I won't discuss that for now that would be probably a bit too much but with that being said let us take a look at the day after meaning it was St this delivery and I already had basically plans for recording the breakdown for this trade for you but then Friday came along and Friday the market dropped exactly into the same point of interest at the right time and I took again along I will walk you through that as well here we are at the same early chart and as you can see I've annotated the imbalance again the previous week's High the CB now as well and the briefest M's High what I want you to see is that on Thursday the market didn't really trade outside start the range of that early CB Sur we we traded above it a bit here but notice that we didn't this place away from it that right there showed to me that going into Friday I was anticipating that we were likely going to be stuck between this higher blue box and this lower box right here meaning I anticipated price to be stuck between this higher CB right here and this lower BC I was anticipating the market to go back and forth back and forth back and for range bound delivery now what I want you to understand is that what you are going to see is you're going to see me go long on ndaq from this lower BC right here targeting this higher CB enjoy the recording [Music] spe [Music] [Music] is he getting right now get is he getting right now [Music] for spee speech [Music] [Music] [Music] spe today I'm muching [Music] [Music] get my [Music] [Music] get fore [Music] [Music] [Music] so we have just watch my execution from Friday utilizing the same point of Interest as I did on Thursday what I want you to see is that when I annotate very specific times we can see the F what we can see is that I've annotated the 10:00 hours on both Wednesday as Thursday besides Friday meaning we can see 10:00 being annotated on Wednesday right here this imbalance on Thursday 10:00 being annotated right here and on Friday 10:00 being annotated right here I want to ask you what do you notice between Thursday and Fridays it's respective 10:00 to get free do you see that we open drop lower into that old bullish R fire gap which formed at 10:00 on Wednesday its respective price range before expanding away guys you tell me yes you tell me that that right there is buying or selling pressure stepping in at that moment in time during that very specific time window referring back to that very specific previous timebase range causing the market to then reprise higher I'm sorry but at some point you just have to acknowledge there that there's way more going on than what you see just everyone speaking about once you begin to investigate these algorithmic signatures week in week out you're going to gain a level of understanding that's absolutely insane to the majority of people when you discuss it with them and you're going to discuss what you see within the delivery of price with them and they're going to look at you and they're going to be like there's freaking no way what's this guy on about but guys they don't need to understand I know that all the people that are watching this lecture I know that probably 90% of you will not understand what I'm trying to share with you and what I'm showcasing to you but in all honesty I'm not speaking to the 90% I'm speaking to the 10% of individuals that are watching this lecture that are willing to investigate the key or rimic signatures at a time based that I'm sharing with them that's is my target audience I don't care about those that other 90% that's too lazy to go into the charts and investigate because I know it's there I'm showcasing it every single week I'm trading based of it every single week think about that I'm literally going out there every every single week utilizing these very specific time based and price based Concepts and I'm just sharing it with you for free all there's left to do from your side is to go into your charts and investigate and honestly if you are going to spend let's say one to three months after having watched this lecture going into the charts and investigating for yourself whether or not there's any validity behind the things that I'm sharing with you and then come back to me and say man I'm so grateful that I investigated what you taught me to investigate that right there is what I want to hear and I'm so grateful for the students of mine that have been sending messages to me whether it be through Twitter whether it be through Instagram whether it be through for example email and they're just showing their gratitude to me and I just want them to just keep going with with what they're doing because I know what it felt like for me the first time that I began to see these very specific algorithmic signatures week in week out day in day out and I hope you will be able to experience the same one day but in order for you to get to that level of okay understanding time and price you must first be willing to put in the work you must first be willing to go into the chart yourself after having watched this lecture after having investigated everything that I shared during this lecture and that you understood everything that I shared within this lecture when you then go into the chart yourself and you're going out there and you're investigating and you're seeing the same algorithmic signatures over and over again that is where the growth is taking place because you're training your eye to see these very specific signatures and price and when you see them you're going to be like what the f how did I not see this prior and it all has to do based on time and price Cycles time Cycles you know price Cycles you don't and I will not discuss them but with the being said let's continue with the breakdown what I want you to do for yourself is I want you to go into the hourly chart of this delivery of the 11th of October or the week of the 11th of October I should say I want you to investigate this low formation right here which took place at 9:00 a. m. I want you to investigate this low formation which also took place at 9:00 a.
m. that's so Random right here we are on the one minute chart of ndaq and what I want to discuss with you is the F here you can see my executions for this this morning session and what I want you to see is the f I want you to see that after 8:30 A.


![How To Trade Futures Contracts [Full & Live Explanation] | Trading Tutorials](https://img.youtube.com/vi/sJELO5PGY00/maxresdefault.jpg)