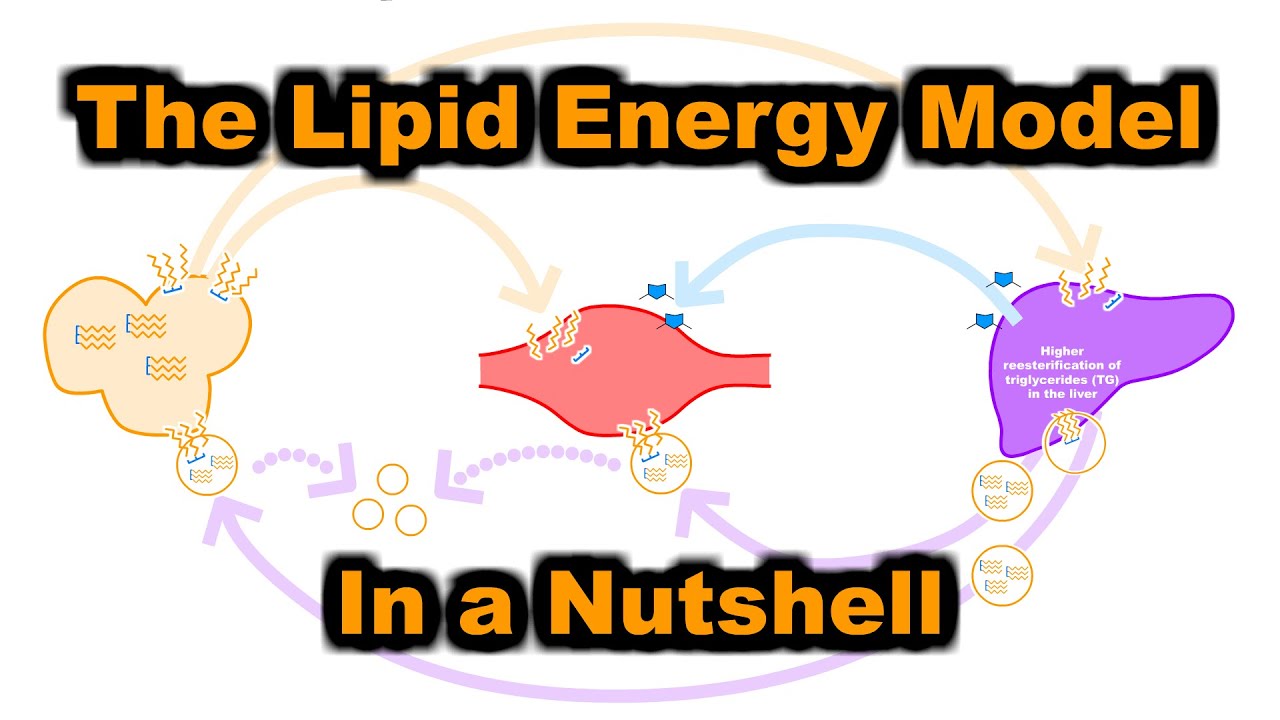
great so first things first Oh continue Annalise had actually a bit of a longer longer title for this but I would just generally call this the little bit energy model of work-in-progress and her maybe this working here we go so I'm actually going to be covering quite a lot but I think I structured this pretty well so hopefully it'll maximize to retention I'm not even going to list off all of these because we're about to go into it but this is me and this is kind of a basic bio I'm a senior software engineering business developer I've been architecting software platforms for over three decades and the last startup I partnered in was bought by one of the largest gaming companies in the world so I've done pretty good and this kind of actually set me up to have a decent nest day to do what ended up happening next this is me now I started a ketogenic diet in April of 2015 and I have to say for the first seven amazing months I felt better than ever and then I got some cholesterol numbers I was not happy to see my total cholesterol had actually jumped to 329 and this really kind of put me in a little bit of a state of depression but I was very happy with the ketogenic diet so I started studying everything that I could find on cholesterol and lipids system this is typically collectively known as lipid ology what I found was actually a pretty familiar pattern just a software engineer particularly a systems engineer I tend to work on networks and indeed that's what the lipid system presented to for me I mean I'm going to be talking about a lot of the different aspects of this but let's just say that there are many things that emulate for example having headers or having packets many ways in which these objects talk to each other and form like cloud ops things that I've already worked with quite a bit already and so I threw myself into what I think a lot of people would call bio hacking but I would refer to as citizen science I started taking all kinds of measurements to I think a lot of my friends would say an obsessive degree in fact a good example is that I actually photograph every single thing I ingest when I stay I photograph everything I ingest I mean not just food and specialty beverages but I mean also water supplements even gum if it's anything that could have any impact on my markers it's something that I'm going to capture actually look this morning and I think I have 47,000 photographs in the four and a half years since I started and this by the way is matched with this is not hyperbole 126 blood tests in the last 55 months and these are actual blood draws as in I went to LabCorp actually got them drawn and they all include an advanced lipid test known as a nuclear magnetic resonance test and that becomes very relevant in the research you're about to see so this is really kind of what got me started I call it the inversion pattern and here's sort of the story behind it see those first eight blood draws that actually happened over for three months time so we're talking November 2015 to around the beginning of February and what you'll see here is a graph where it's a three-day average of dietary fat versus LDL cholesterol and this is a relative comparison so on the left side these are grams of fat and when I say relative comparison you see that doesn't start at zero and this is against on the right side LDL cholesterol blue so what I noticed was my LDL see going up and down like this actually because I was already tracking my food so closely actually lined up inversely with my 3 day average of dietary fat which you see in this dashed orange line and that got me pretty excited to consider trying an experiment so I colloquially call this the week of needles because for one week I quite literally had my blood drawn every single day and I did it against a pre-planned food this this basically was eating the food to try to induce this particular pattern first having low amounts of fat and then having higher amounts of fat to see if I would get a likewise reflection in my LDL cholesterol and that actually just would happen and then of course for a data fifteen I decided what the heck let's step on the gas let's actually see if I could bring my dietary fat way up to see if it would bring down my LDL cholesterol and that too is what happened it actually brought it way down I'm not going to go through all the experiments since then but at least in a ketogenic context these are all 29 of my first blood draws in that context and as you can see this inverse pattern continues in fact to make it a little more pronounced I'm going to flip this left axes over here and you can actually see now that its flipped just how tight this inverse correlation actually is the Pearson is negative 0. 8 and regression is point six four eight it's really remarkably tight if you want to see the scatter plot looks like this this will also be in the slide deck I call this the dietary fat inversion for LDL cholesterol and indeed the resulting ldl-c tends to be very predictive against the last three days that I was eating beforehand and in particular the dietary fat so to go back to my graph for a sec and to still keep this inverse what I'm saying is each of these couplings basically could be looked at this way I'm recording this on the morning of a Friday so to give you a real world example if this is Friday what I would do is I would look back to the day before which was Thursday yesterday the day before that which is Wednesday and the day before that which is Tuesday and those three days together would be highly predictive inversely with what my morning LDL cholesterol test would be and to really kind of drive this point home I mean just looking at those three days and not looking at say day is four and before that that's pretty powerful but on top of that this also applies for LDL particle count low-density lipoprotein or LDL P interestingly though it's with a to date yet I don't have enough time in this lecture to get into my physiology hypothesis on this but in effect if we were to use the same pattern rather than looking at yesterday Thursday and the day before that Wednesday I would start at Tuesday the table or that Monday and the day before that Sunday and I actually had that reconstructed in the next graph only this time this purple line represents LDL P in a relative comparison and at this dashed orange line is the 3d average of dietary fat but with a two day gap so this is what the new reconstruction looks like I'm going to flip this axes again so you can see this inverse tracking and as with the LDL seat grat graphed before it doesn't track perfectly there are some gaps in some places right but it still has a remarkably tight correlation person even a little bit tighter at negative 0. 8 one and the regression at six six seven okay so what happened next is I got an experiment going I actually got a number of people to do this with me at a conference and here's how I worked basically I instructed everyone to say hey let's go ahead and be either low calorie low carb high fat all of them were on a low-carb diet we're just straight-up fast for the first three days 11 12 to 14 hour warfare fasting overnight and then we'll do the first two blood tests which is on the morning of July 14th this is in 2017 then everybody can go ahead and eat as much food as they want in fact even better if you could have lots and lots of saturated fat then another 12 to 14 hour water fast for the overnight and a final second morning of blood test and I posted the hypothesis in advance and said following the second phase of the higher dietary fat I predict the resulting LDL cholesterol for the majority of participants will show a decrease when compared to the first here are some photos from the road I'm very happy that pts Diagnostics helped me out with this they both helped us take measurements with their cardio check but also to do lab draws for both LabCorp and quest and this is now a graph that I like to call the broken ladder as in you can see this represents all the different data points for people's LDL cholesterol when they started on Friday 7 14 17 and then this is three days later on Monday 7 17 after the intervention of having a lot of high fat throughout the festival indeed we have 19 of the 22 had a decrease of between 5 and 38 percent of their LDL cholesterol whereas just three had an increase of one to two percent so about an eighty five percent success rate which anecdotally seems to be what we see when people reported in at our website this is also shown here in the average change is ldlc of about minus 16 percent across the board a drop about twenty five point seven milligrams think some audio is going on somebody so you can see here that actually this is reflected in all the different rows in which we've got blue those are that's everybody who saw a drop in the LDL sea while those in tan are where we saw that small increase so consuming a lot of fat while on a low-carb diet and typically results in lower LDL C from baseline I do want to emphasize baseline because like me many of these people had a higher baseline LDL cholesterol but in this short span of time their LDL C would drop why well this is really what got me started it on what I like to call the lipid energy model I'm going to take you through four different parts of the energy model to try to kind of explain not just the inversion pattern but what I think is kind of going on overall with the locard diet the reason in which you might have higher levels of cholesterol being detected so let's go through part one and four but first a disclaimer but many parts of this presentation for the ng model are simplified to provide general concepts many aspects are not covered in depths such as insulin glucagon HPA axis and ketone pathways all of which are relevant to this model I can speak to more the nuances in our Q&A and really I can speak a lot more to that once our paper is out but the point is its presentation of course I've got to simplify a number of things just wanted to give that it just want to put that forward so let's talk about the three macronutrients you hear about all the time which is carbs protein fat and of course you already know that cards to convert to glucose protein candy convertible goes for gluconeogenesis these are all simple molecules that ready to get into the bloodstream and we'd love to talk especially in the ketogenic community about how fat gets converted to kita and why it's called the ketogenic diet but I would argue that's a little bit deceptive because a lot of people feel like a hundred percent of your fat gets turned into ketone bodies the truth is actually fat has many other ways of getting direct delivery to your cells it can be delivered via triglycerides on lipoproteins and also is non-esterified fatty acids but I really want to focus especially now and this pathway in triglycerides coming on to on lipoproteins and to do this we need to kind of go through the lipoprotein lineages obviously this is a boat and I do this for not these savvy biochemical audiences you guys are but basically I'm trying to drive home that's a way to move something that's of course hydrophobic through an aqueous environment which is your bloodstream a chylomicron is one of these lineages it's known for having an april b48 liberal protein that's part of what denotes and it comes from your small intestine because of food you just ate so I eat some food have a lot of fat in it it gets packaged into a chylomicron and it's very bloated with triglycerides just like a little bit of cholesterol which isn't represented here but the main point is these triglycerides are distributed to my peripheral tissues throughout my body and very quickly and I mean in just minutes this becomes a chylomicron remnants and gets quickly absorbed by the liver but this is counterbalance with another lipoprotein which the liver makes it makes vldls which also have a lot of triglycerides and also deliberate dropping off a lot of their triglyceride cargo through my peripheral tissues and I would call this category the energy delivery category now there this isn't the only thing that lipoproteins do they also have a support role and this brings up a very famous supporting lipoprotein known as HDL high density lipoprotein and indeed this one particularly the cholesterol on board is associated is associated with better cardiovascular outcomes now I would also argue that there's another famous lipoprotein which we've all heard about planning LDL also comprises a support role it's a little less than elven but in fact it actually has lots of involvement in the immune response it binds to pathogens it provides alpha tocopherol known as vitamin E it's can be endocytosis by yourselves for constituent components and so forth well let's just for the moment for the sake of argument say that as part of the support role and we put this all together we see that basically we've got one category of energy delivery and across the dotted line support so energy delivery support now one more time energy delivery support and what I'm trying to draw attention to is that there's just one lineage of lipoprotein the April would be 100 lipoprotein that is pulling double-duty vldls are providing energy LDLs are providing a support role most of the lipoproteins are leaving your liver are going to be vldls in iraq 1/2 of those are going to be absorbed as ideals to the liver but another half are going to remain as LDL particles and what I hope this make a lot more sense in this context is when you look at this in the context of time which if we're looking at the be LDL to LDL life cycle we see that vldls they last around say 30 to 60 minutes and as ideals less than 30 minutes this is just representing in pixels what's the rest of this time what does that account for about 2 to 4 days as an LDL particle so put another way about 1 to 2 percent of the stages for the sabo be 100 are going to be as a VLT level or an ideal and if it's not absorbed by the liver the rest of the time 98 to 99 percent of time it's going to be as an LDL I think it's no coincidence that this is roughly a two to four day residence time when in fact you see that that inversion pattern includes about a three-day window so with that in mind let's look again at this but let's go ahead and actually add a an additional column which I'm going to call remaining because again these being simple molecules effectively they don't really have anything remaining like they do say a lipoprotein where if you are trapping in a lot of these VL deals you're going to have a low-density lipoprotein remaining and in fact if you're trafficking a lot of yield deals it makes a lot of sense while you would have a lot of LDL particles remaining so to kind of drive at home I'm going to take it back to this graph with the LDL cholesterol and I'm going to say okay what if I what if I'm in a hypocaloric state on a low-carb diet or I'm just straight-up fasting right well then that means that there's a few incoming chylomicrons there's probably less glycogen stores since I'm going to look her back fat diet therefore necessitates more like pollicis more lipolysis brings those fatty acids into the liver to drive greater VLDL secretion and thus there's more LDLs resulting conversely let's say I'm eating lots and lots and lots of fat lots of incoming chylomicrons and that necessarily means that there's less and less veal alleles that need to be trafficked to provide the energy and thus less LDL is resulting so let's talk about the next part because I want you to think about this from a staging and pacing standpoint of the energy itself now I'm taking this graphic actually from a great paper fatty acid metabolism and adipose tissue muscle and liver and health and disease what's great is they sort of break down the inputs of both of these categories of postition in skeletal muscle in particular which I'm really interested in for example in the input for adipose tissue for you to go to your adipose tissue right now or and you were to say hey how much of the fats have you gotten from triglycerides that were onboard lipoproteins and say about ninety percent forty five grams in a day relative to the five grams I get from me bus non-esterified fatty acids conversely if you look at skeletal muscle it's almost a it's gotten just 10 grams a day from triglycerides onboard liberal proteins it actually gets twice as much from non-esterified fatty acids this is a flip from its neighbor nearby and that's because these non-esterified fatty acids they're mainly coming from adipose tissue and so to kind of drive this home with a an analogy you all know if FedEx you know FedEx has a lot of packages it's getting around to these local facilities and then these local facilities they have smaller vehicles that are delivering these packages out to your homes in the neighborhood we can kind of think of this as the global distribution chain right you can think of this as the local distribution so if we flip this we're looking at vldls and chylomicrons supplying their triglyceride cargo to adipose tissue which helps with local distribution of these non-esterified fatty acids to cells and of course some amount of these are getting really right back into adipocytes so let's take this to the 50,000 foot view let's talk about this between a Fed State and a fasted state so what's happening in the fed State well especially if I'm on a low-carb diet I have a lot of incoming chylomicrons and some residual VLDL ISM were to be doing well of course they're supplying some amount of energy to my muscle tissue to my cardiac tissue to organ tissue etc but on top of that they're reap leading my adipose tissue in bulk now of course eventually I'm gonna get to the fasted State hopefully between panels and overnight we don't want to be in the fed state and definitely and what's happening is of course the insulin is going down the glucagon is going up and now adipose tissue is providing more and more non-esterified fatty acids especially to nearby and adjacent tissues and the LDLs are supplying some degree of direct delivery but the important thing is to remember even in this fasted state we do still need to have vldls we're pleading the adipose tissue it's this is I think I can't emphasize enough that this distinction is very important to understand and this is the wide availability of energy to cells that I consider to be crucial the problem isn't one of total energy the problem is one of energy distribution cells govern their energy status locally with limit in an individual control over the larger process thus it's the role of the body as a governing system to make energy available to cells on demand whenever and wherever it is needed I can't emphasize enough that this is actually a very challenging engineering problem if you think about it your your body is a hundred trillion you know give or take a dozen trillion cells most of them are nucleated and they're expected of energy well the problem is is if you were a diner with a hundred trillion customers you can't just have them order off the menu what's easier to run than a made-to-order diner is a buffet and a buffet is much easier and the reason is is because you don't need to watch the customers you just need to watch the buffet line and that's basically what our blood stream is it's a buffet line of energy and that's a lot easier to solve particularly if you have all of this subcutaneous fat all placed around the body and it's just a matter of constantly making sure that they get refill to proper amount so let's get to three or four which is going to be the merging lipid profiles so naturally you gotta ask what about when you're metabolically inflexible so let's go to back to this top view and let's say that you're kind of stuck in a Fed state and that doesn't necessarily mean that you're just literally eating around the clock that could mean that your body believes it's in a fit state it's for example it says that with hyperinsulinemia well of course we have lots of data that shows that you end up with a lot more the LDLs and you have been something that could be called a maxed out pathological fat threshold someone call it a personal factor s hould and what does this associate with it associates with also an increase in ectopic fat and again this makes sense to me as an engineer because there is one place you really don't want energy part more than in tissues like the liver and the pancreas in the heart where the ectopic fat goes and that's in the bloodstream that's very scarce space so of course it has a hierarchy of affinity you really want to be using your attic posters you want to be using those adipocytes because they're the pros they're great at staging and pacing energy and that's why this could be so associated associated with the Z needs and that's why I comes with a profile that we know pretty well by now known as atherogenic dyslipidemia it's characterized by low HDL cholesterol and high triglycerides along with the preponderance of small dense LDL particles the truth is you could really just look at your HDL cholesterol and your triglycerides and if this is low this is how you probably have a high preponderance of small dense LDL particles and yes it's usually a pretty bad sign and that's why a lot of people go on a low carb diet because oftentimes it can help with that aspect in particular indeed this is highly associated with hyperinsulinemia remnant lipoproteins ectopic fat cardiovascular disease and of course the mother of them all one that I'm very interested in which is all cause mortality but could there be fat adapted flexible metabolic profile well for that I kind of want to bring up the counterpart to average eight dyslipidemia which I regularly call the low carb lipid triad see a lot of people who go on this diet they'll often see their HDL go up that's good they'll see that your triglycerides go down that's good but then and ironically even when they tend to be healthier in general you see their LDL cholesterol go up and that ends up being a big sticking point sometimes humorously call this reverse atherogenic dyslipidemia and sure it's associated with low insulin levels low V LDL and low remnant lipoproteins but will it associate with low ectopic fat low after is ground and cardiovascular disease and low all cause mortality that's the question well before I get to that let me get to the last part of the energy model and this one's a little more esoteric but it comes back to the paddock glycogen stores and it kind of set this up I want to take you through what I called the carb swap experiment and basically this is what I did this was a few years ago I had this Vyasa caloric I was having 3,000 calories a day a thousand calories at 10:00 a.
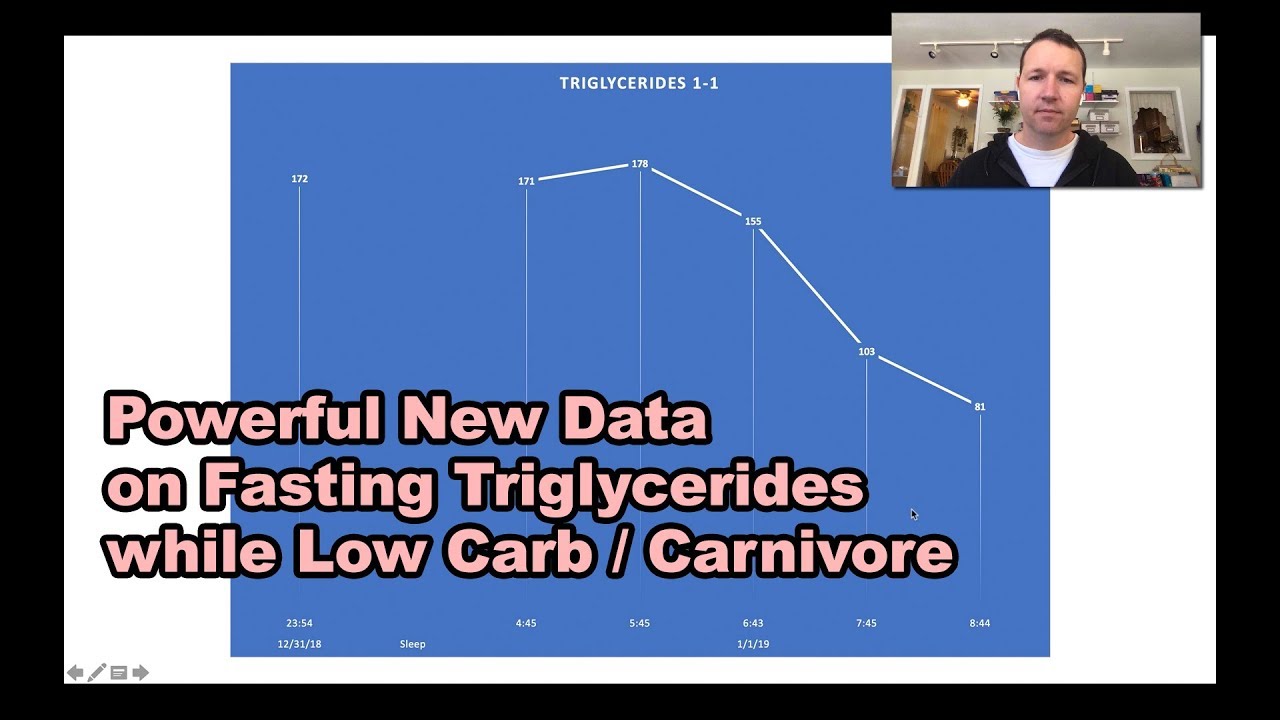
m. 3:00 p. m.
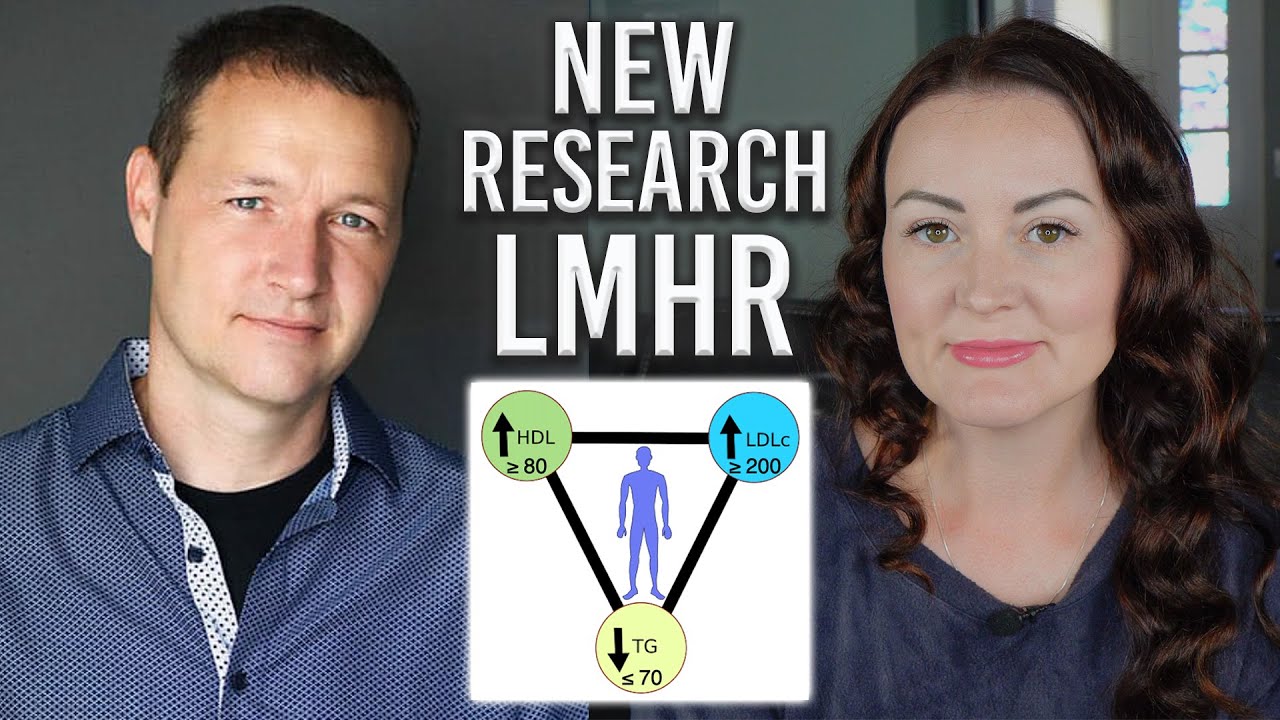
and 8:00 p. m. on what is a meal replacement shake for ketogenic diet it's nutritionally complete and the intent was for me to be able to have something that I could have very tight control over and for which there wasn't a lot of variability for the first three days that's what I ate and then for my intervention I had 500 calories in the form of carbs that came from bread and then a thousand calories the day after it was an isochoric swap so I still kept at 3,000 for both days then for another two days I kept adjust the shakes and then I had to do some traveling so we went to on a 2,300 and then 1,500 calories past that point but it was still ketogenic so this was the only period of time which I wasn't ketogenic so what happened well as you can see my total cholesterol at that time was still at that whopping high level that I told you about at the beginning while on this ketogenic diet 313 326 320 so you can see it's kind of hovering and then you can see on day four and five as I'm adding in these carbs in the morning of we can see that my cholesterol is starting to drop up couldn't get a calculated clean LDL see because if you're under fifty milligrams per deciliter of triglycerides and it's you can't actually calculate it but but then here's what gets interesting I go back to the ketogenic diet and yet my ldlc continues my total cholesterol continues to go down my LDL see the very end ends up at about 131 I believe that this had to do with raising my glycogen stores which fit ultimately results in lowering cholesterol why well some studies and literature suggests that lower relative paddock glycogen stores and due to greater rate of lipolysis and and this could make sense given it will provide greater short-term energy buffering in place of the missing glycogen availability this higher level of lipolysis could lead to greater VLDL secretion and thus more successive LDL particles now I wanted to finish with one more experiment that I did that probably is the most talked about it experiments and with all of the rest of the energy model in mind this will make a lot more sense to you it's called the white bread experiment what you're seeing in front of you is exactly what I was consuming and only what I was consuming it was white bread and lean processed meat along with water and some supplements to you know try to keep to some nutritional completion and yeah I have a whole bunch of pictures that look just like this in fact the reason I chose white bread and lean process to me which one of my friends jokingly called the prison food diet is intentionally because it was low quality food because I didn't want going from a low carb high fat diet to a high carb low fat diet to be a question of whether the food composition was better as in you know if I for example had lots of kale salads and so forth that might be considered that there were other factors involved and I don't think that there are I think it's mainly about the energy substrate and the metabolic pathway that's why I chose this so and having lots of white bread and processed meat what would this do in an overconsumption with my cholesterol levels well on 920 of 18 my LDL was a whopping 296 coming off of a ketogenic diet and starting getting into this experiment where I then flipped over to eating the white bread processed me you can see the day after that it was 233 the day after that 198 then 160 and 147 102 and as predicted in a time-stamped video that I made before I did this it reached the lowest LDL cholesterol I've ever had at 83 83 is this ended up being a drop of about 213 milligrams per deciliter and one week of my LDL cholesterol and while that might not make sense to a lot of people I want to drive this home with what I was talking about before and that indeed instead of being powered by ketones and triglycerides which might leave more remaining LDL PD I was being powered a lot more by carbs and possibly to some extent protein now that's not the full story it's not strictly what the metabolic pathway is obviously there are other factors for example I was becoming hyperinsulinemic therefore I was pinning in a lot more of those fatty acids and reducing lipolysis by over consuming as well as actually repeating my glycogen stores in the liver so while I can make fun graphs like this flip that experiment this was the other graph I made with the triglycerides and HDL you can see the triglycerides precipitously go up till I'm at around 221 on that last day and I reached the record low 38 in my HDL it kept continuing to drop to somewhere I'd never seen it before now I'm seeing carb overeating studies where it showed that there wasn't that much de novo lipogenesis I certainly do think that this 221 reflected at least some amount of de novo lipogenesis with me in particular but you know without a tracer study I can't say that I know for sure so this leads me to talk about the phenotype of a special interest to me and this model called lean mass hyper responders kind rolls off your tongue right and I apologize but there's kind of a history as to why they're named the way that they are so of those going on a low-carb diet you'll see that some will have this dramatic increase in their total and LDL cholesterol and long before I became involved many doctors like Peter attea and Thomas days Fran would call these hyper responders but I started to notice that there was actually a very specific pattern that included the highest total and LDL cholesterol and counter-intuitively they tended to be very lean and athletic we call these lean mass hyper responders to sort of put this in perspective in a visual way if this was a triad typical of those people were hyper responders this is what I see as the triad for lean mass hype responders now very high HDL cholesterol and in very low triglycerides coupled with very very high LDL cholesterol and about three years ago I wrote this article that included this graphic which I'm going to take you through and I posited that cholesterol scores can be higher for those who are lean and or athletic on a low-carb diet and the cut points that I gave all three in combination that this was seen often with people who I observed would have an LDL at 200 or higher an HDL of 80 or higher triglycerides of 70 or lower now all three of these if you look at the literature the all three of these are actually very rare in singularity it's actually very hard to find people who have an LDL that's high and HD find anybody who has an HDL this high triglycerides this low and as I do with this model I posited that perhaps this was lower glycogen stores in combination with lower body fat and also in combination with higher energy demands from being an athletic or active thus lipoproteins may be needed to traffic a greater amount of energy from fat resulting in higher LDL cholesterol markers it's sort of funny even now these days I think of things I wish I could have said differently in one of them's I would have said like energy potential instead of energy from fat but anyway this is the banner from the lean mass hype responder Facebook group so you know how I said how rare it is to even find those markers an individual well this is a group full of people now lots and lots of people these are the these are unicorns because these did not exist in these large data sets from before this point in time before ketogenic diet became a lot more popular and you'd be forgiven if you thought that this was a fitness group it's not a fitness group what brought these people to our group is their lipid numbers and that's why if somebody gave me lipid numbers that looked like an LDL above 200 HDL above 80 and triglycerides below 70 without knowing a single other thing about you I would guess that you're probably very look hard you're probably lean and you're probably at least fit if not atletic and the vast majority of time people commenting a closed-door code goes yeah that's right how did you know that well this is what I would posit is going on but before I do let me tell you what's common for the lean mass type responders they have low cardiovascular risk and having low insulin levels low waist-to-hip ratio you've seen low blood pressure triglycerides low inflammatory markers low Homa IR and of course high HDL cholesterol so what's their high cardiovascular risk marker there's just the one it's a high LDL which of course means high LDL P and a high a bo B in this case so did this exist in the literature before well there already were people who were kind of looking into this including great work from Volek and Finney and in fact the studies from a couple years ago where they studied athletes and they divide them between a high carbon low carb and indeed we see that the low carb athletes the total cholesterol would tend to be higher their LDL see would ubiquitously be higher and as they stay here the observation that highly-trained ultra endurance athletes consuming a very low carbohydrate high fat diet exhibiting a more dramatic and uniform hypercholesterolemia is counterintuitive since high volume exercise tends to lower total and LDL C levels and I can actually speak a little bit more to that in the Q&A but there's an experiment that I did to specifically lower LDL just from exercise while keeping all other else all other things the same so this is what I in the energy model and again this is a hypothesis but it goes like this in a fasted State for these limits hyper responders we have a different situation than what I described above we have lower total adipose mass and because of that we're going to need to traffic more vldls off the existing fatty acids and that by the way also means more VL deals we're pleading and that's okay from a systemic standpoint this is actually something I'm used to with networks all that's really happening is basically a faster version of load balancing but they're both sites are already used to doing this it's again it's what they're pros at doing and it's also it'd be else vldls do if we thought this actually was putting stress on the liver we would expect to see this from her example with higher inflammatory markers like C reactive protein and so forth but we don't we actually see extraordinarily low levels of c-reactive protein and what appears to be at least in the early data to be very strong healthful liver which I find to be very instructive so studies that help to support the energy model I'm picking just a few we actually have something like a couple dozen that we'll be using paper well let me ask each of these questions and provide one study to show you can fasting increased cholesterol yes fasting increases serum total cholesterol LDL cholesterol and able lipoprotein B and healthy amount obese humans and this is a multi-day fast you can see that their total cholesterol goes up their LDL cholesterol goes up their apoB goes up also and high HDL sea levels relate to the LDL triglyceride turnover indeed the concentration of high density lipoproteins it's related to catabolism triglyceride rich lipoprotein so of all places we're getting this from chronic alcoholic users and you may not be able to see this because of the screen capture but they had them drinking first and then actually checked after abstinence to see what their fractional catabolic rate is and it does indeed go down as does their HDL and of all the interesting places to find for lean mass hype responders are there examples of those with very lean mass and lower glycogen stores having higher LDL see we see this with those who have anorexia nervosa so that often times their total their HDL and their LDL cholesterol could be higher now by this point in time if there's not already a queue full of this question this is what on what's on a lot of people's minds which is that swell Dave but what about the risk okay is it high LDL cholesterol always bad and spoiler alert as I say often I don't know in fact there's a particular phrase that I like to say which I don't have in here which is I like to say I'm cautiously optimistic in this context and by saying that I'm acknowledging the level of uncertainty even if I have a leaning so I am sure trying to find out for this context in particular for particularly for the lipid triad one thing I'm a little bit semi-famous for it is this graphic that I've circulated for some period of time because I sought to find any and all studies related to the lipid triad and it's Association cardiovascular disease risk especially in normal non treated people in fact even when so far is to actually have a reward I'm willing to give away for example $1,000 to somebody is a kind of finder's fee if they could find the lipid triad specifically those things that meet this criteria for which we see just even above average cardiovascular disease I'm sorry this link is obscured but you can just google it on my site but I wanted to provide it to you guys because you can all participate that the reward money is still outstanding so there are however studies that do look at this triad that are showing the reverse for example this is from Framingham Offspring and I really like the study because they exclude users of lipid-lowering therapy it was 3,600 men and women what we find is that they stratified between high HDL c and a low hdl-c and unsurprisingly those people had low triglycerides and low LDL cholesterol below 100 actually had the best odds ratio everybody on this chart but what's interesting is you would have thought that if you flipped it and looked at everybody who had know the old 100 or higher that it might be an odds ratio and a 1.
3 or 1. 4 but it's not 0. 7 even if you focus a lot on it being a point one higher the fact that the triglycerides being low in the HDL being high is quite substantial but they even have further one where they looked at LDL at or above a hundred and thirty it's still the same it's an odd ratio is 0.