Welcome to our data analysis with Python tutorial. My name is Santiago and I will be your instructor. This is a joint initiative between Free Code Camp and remoter.
In this tutorial, we'll explore the capabilities of Python on the entire PI Data stack to perform data analysis, we'll learn how to read data from multiple sources such as databases, CSV and Excel files, how to clean and transform it by applying statistical functions and how to create beautiful visualizations will show you all the important tools of the PI Data stack pandas, matplotlib, Seabourn and many others. This tutorial is going to be useful both for Python beginners that want to learn how to manage data with Python, and also traditional data analysts coming from Excel, tableau, etc. You learn how programming can power up your day to day analysis.
So let's get started. Let's quickly review the contents of this tutorial. This is the first section and we are going to discuss one is data analysis.
We'll also talk about data analysis with Python and why programming tools like Python SQL and pandas are important. In the following section will show you a real example of data analysis using Python. So you can see the power of it will not explain the tools in detail.
It's just a quick demonstration for you to understand what this tutorial is about. The following sections will be the ones explaining each tool in detail, there are two more sections that I want to especially point out. The first one is section number three Jupiter tutorial.
This is not mandatory, and you can skip it if you already know how to use Jupyter notebooks. Also the last section Python in under 10 minutes. This is just a recap of Python.
If you're coming from other languages, you might want to take this first if that's the case. all right now let's define what is data analysis. I think the Wikipedia article summarizes perfectly the process of inspecting, cleansing, transforming and modeling data with the goal of discovering useful information, you forming conclusions and support decision making.
Let's analyze this definition piece by piece. The first part of the process of data analysis is usually tedious. It starts by gathering the data and cleaning it and transforming it for further analysis.
This is where Python and the PI Data Tools Excel, we're going to be using pandas to read, clean and transform our data. Modeling data means adapting real life scenarios to information systems using inferential statistics to see if any pattern or model arise. For this we're going to be using the statistical analysis features panelists and visualizations for matplotlib and Seabourn.
Once we have processed the data and created models out of it, we'll try to drive conclusions from it finding interesting patterns or anomalies that might arise. The word information here is key, we're trying to transform data into information, our data might be a huge list of all the purchases made in Walmart in the last year, the information will be something like pop tarts sell better on Tuesdays. This is the final objective data analysis, we need to provide evidence of our findings, creative readable reports and dashboards and aid other departments with the information we've gathered.
Multiple actors will use your analysis marketing, sales, accounting executives, etc. They might need to see a different view of the same information. They might all need different reports or level of detail what tools are available today for data analysis.
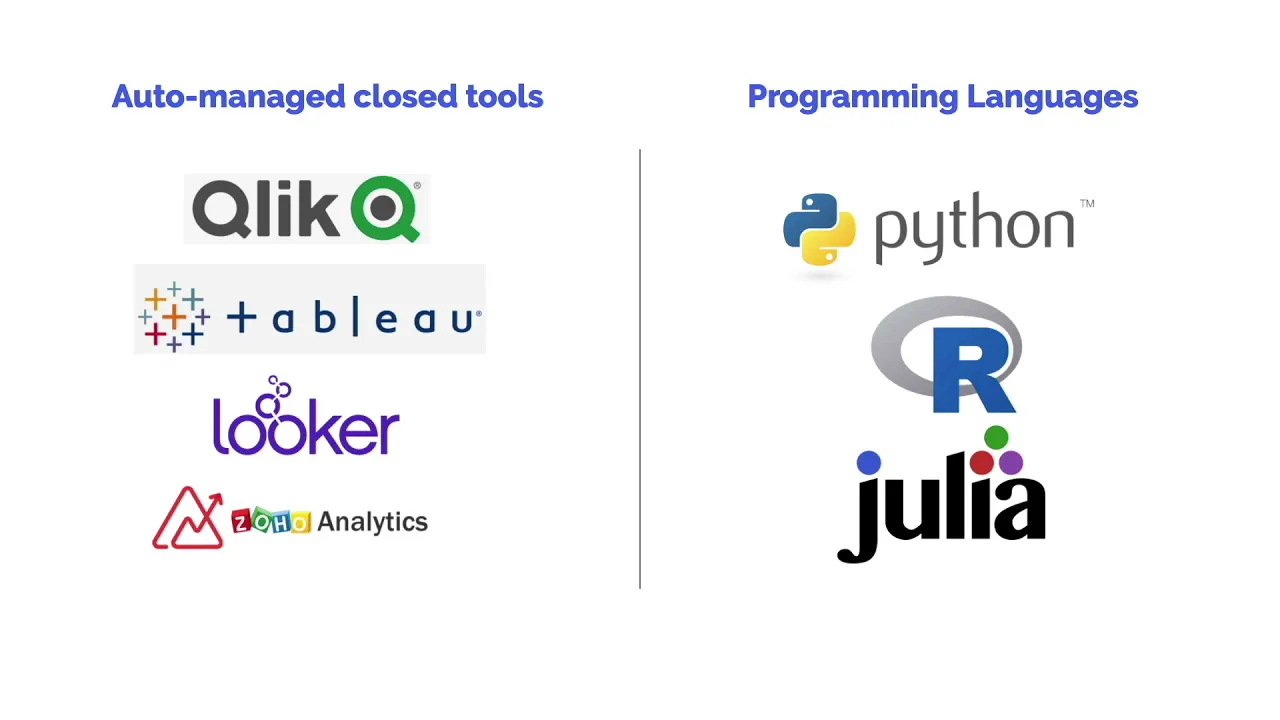
We've broken these down into two main categories. Auto manage tools are close products tools you can buy and start using right out of the box. Excel is a good example.
Tableau and luchar are probably the most popular ones for data analysis. In the other extreme, we have what we call programming languages, or we could call them open tools. These are not sold by an individual vendor, but they are a combination of languages, open source libraries and products.
Python R and Giulia are the most popular ones in this category. Let's explore the advantages and disadvantages of them. The main advantage of closed tools like Tableau or Excel is that they are generally easy to learn.
There is a company writing documentation providing support and driving the creation of the product. The biggest disadvantage is that the scope of the tool is limited, you can't cross the boundaries of it. In contrast, using Python and the universe of PI Data Tools gives you amazing flexibility.
Do you need to read data from a closed API using secret key authentication for example, you can do it? Do you need to consume data directly from AWS kinases, you can do it. Our programming language is the most powerful tool you can learn.
Another important advantage is a general scope of a programming language. What happens if Tableau for example goes out of business or if you just get bored from it and feel like your career is taught you need a career change, learning how to process data using a program Language gives you freedom. The main disadvantage of a programming language is that it's not as simple to learn as with a tool, you need to learn the basics of coding first, and it takes time.
Why are we choosing Python to do data analysis? Python is the best programming language to learn to code. It's simple, intuitive, unreadable, it includes 1000s of libraries to do virtually anything from cryptography to IoT.
Python is free and open source. That means that there are 1000s of eyes, very smart people seeing the internals of the language and the libraries. from Google to Bank of America, major institutions rely on Python every day, which means that it's very hard for it just to go away.
Finally, Python has a great open source spirit. The community is amazing, the documentation is exhaustive. And there are a lot of free tutorials around checkout for conferences in your area, it's very likely that there is a local group of Python developers in your city.
We couldn't be talking about data analysis without mentioning r r is also a great programming language. We prefer Python because it's easier to get started and more general in the libraries and tools it includes. R has a huge library of statistical functions.
And if you're in a highly technical discipline, you should check it out. Let's quickly review the data analysis process. The process starts by getting the data where is your data coming from?
Usually it's in your own database, but it could also come from files stored in a different format or a web API. Once you've collected the data, you'll need to clean it. If the source of the data is your own database, then it's probably in writing shape.
If you're using more extreme sources like web scraping, then the process will be more tedious. With your data clean, you'll now need to rearrange and reshape the data for better analysis, transforming fields merging tables, combining data from multiple sources, etc. The objective of this process to get the data ready for the next step.
The process of analysis involves extracting patterns from the data that is now clean any shape capturing trends or anomalies, statistical analysis will be fundamental in this process. Finally, it's time to do something with data analysis. If this was a data science project, we could be ready to implement machine learning models.
If we focus strictly on data analysis, we'll probably need to build reports communicate our results, and support decision making. Let's finish by saying that in real life, this process isn't so linear, we're usually jumping back and forth between the step and it looks more like a cycle than a straight line. What is the difference between data analysis and data science?
The boundaries between data analysis and data science are not very clear. The main differences are that data scientists usually have more programming and math skills, they can then apply these skills in machine learning and ETL processes. The analysts on the other hand, have better communication skills, creating better reports with stronger storytelling abilities.
By the way, these Weiler chart you're seeing right here is available in the notes in case you want to check out the source code. Let's explore the Python and PI Data ecosystem, all the tools and libraries that we will be using. The most important libraries that we will be using are pandas for data analysis, and matplotlib, and Seabourn for visualizations.
But the ecosystem is large. And there are many useful libraries for specific use cases. How do Python data analysts think if you're coming from a traditional data analysis place using tools like Excel and Tableau, you're probably used to have a constant visual reference of your data.
All these tools are point and click. This works great for a small amount of data. But it's less useful when the amount of records grow.
It's just impossible for humans to visually reference too much data, and the processing gets incredibly slow. In contrast, when we work with Python, we don't have a constant visual reference of the data we're working with. We know it's there.
We know how it looks like. We know the main statistical properties of it, but we're not constantly looking at it. These allows us to work with millions of records incredibly fast.
This also means you can move your data analysis processes from one computer to the other and for example, to the cloud without much overhead. And finally, why would you like to add Python to your data analysis skills, aside from the advantages of freedom and power theory is another important reason. According to PayScale, data analysts that know Python and SQL are better paid than the ones that don't know how to use programming tools.
So that's it. Let's get started. In our following section will show you a real world example of data analysis with Python.
We want you to see right away what you will be able to do after this tutorial.


![Upbeat Lofi - Power and Energize Your Workday - [R&B, Neo Soul, Lofi Hiphop]](https://img.youtube.com/vi/ONcY0BM5EAg/maxresdefault.jpg)