hey Traders welcome back to Smart risk today in this video we are covering one of the most powerful price action Concepts used in smart money trading rejection blocks mastering these zones will give you an insane Edge helping you spot institutional activity avoid manipulation traps and align your trades with smart money but here's the real GameChanger I'm not just explaining Theory I'm giving you a step-by-step trading plan built around rejection blocks a strategy that could Skyrocket your win rate and completely change the way you trade so make sure to watch until the end because we're also
revealing the key mechanisms characteristics and institutional Footprints behind rejection blocks giving you everything you need to master this concept from basic to Advanced we always appreciate your support so please give this video a thumbs up and subscribe to our Channel if you are new see you after intro [Music] [Music] welcome back Traders so let's get started starting with the basics what is the definition of a rejection block a rejection block refers to a price level where the market tries to break higher or lower but gets strongly rejected leaving behind a wick it typically forms when
smart money steps in to defend a price level and push the price in the opposite direction a rejection block typically appears when price encounters a key Supply demand area or support and resistance levels and fails to break through however it gets rejected aggressively and leaves long rejection wicks in price action indicating an unusual selling or buying pressure in the opposite direction so let's see the theory behind the rejection blocks a rejection block forms when price attempts to break through a key level or area but faces strong opposition from institutional Traders or smart money causing a
sharp rejection so when the price returns to these zones it often reacts and reverses in the opposite direction because when the price returns to these areas smart money will either defend their positions or initiate the remaining portion of their trades this makes rejection blocks important areas to consider on the price chart so why does a rejection block form liquidity collection or liquidity grab the market needs liquidity to move at Key price levels such as major highs and lows or key supply and demand zones Traders Place stop-loss orders pending orders or breakout entries smart money hunts
these orders to fill their positions this often causes a fake breakout before price reverses manipulation institutions may push price Beyond a key level to trigger and Hunt stop losses only to reverse it quickly trapping breakout Traders this is often referred to as a manipulation or stop hunt once stop orders are triggered smart money executes large sell or buy orders in the opposite direction leading to a strong reversal order absorption this is the core reason why the rejection happens after price reaches the liquidity zone smart money starts absorbing orders for example if price reaches a key
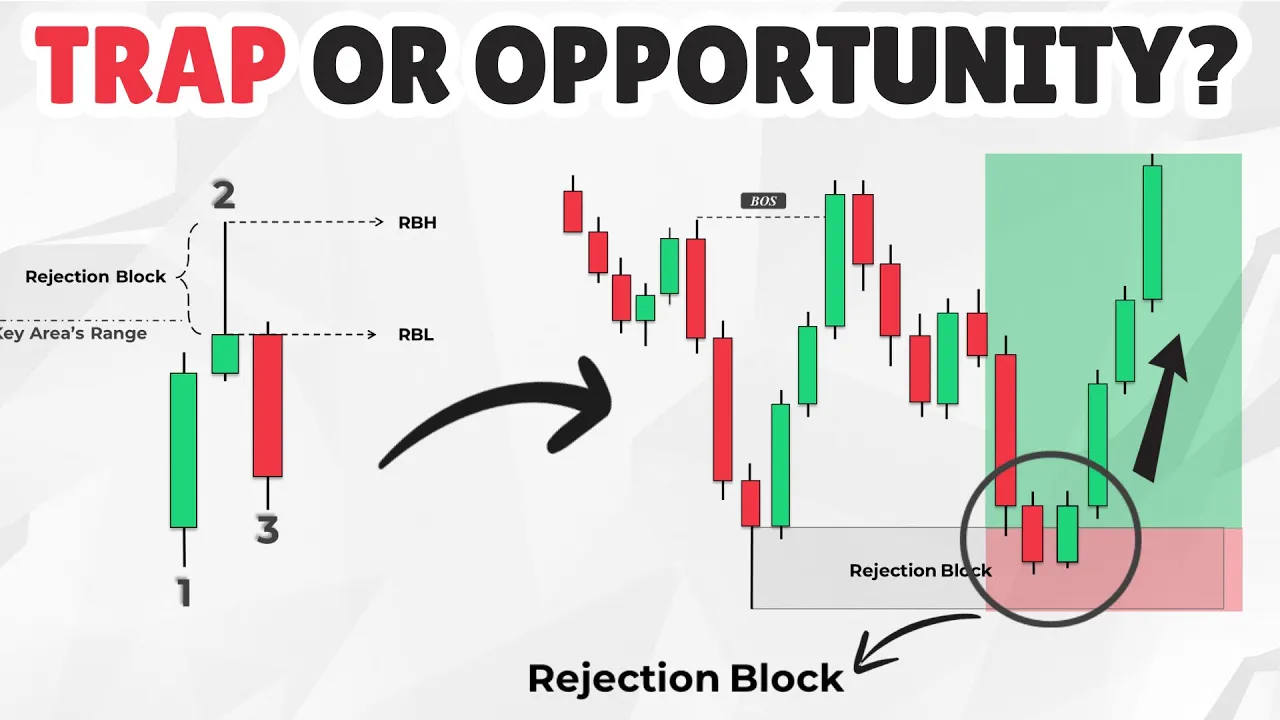
demand Zone institutions flood the market with buy orders absorbing all remaining sell orders as a result price fails to continue lower and gets rejected forming a long Wick price imbalance and reversal after rejection price often moves away rapidly creating an imbalance due to a lack of opposing orders this imbalance acts as a magnet for future price movements meaning price is likely to return to the rejection block before continuing in the New Direction now let's see how to identify rejection blocks from a Candlestick perspective in a bullish scenario a rejection block can be identified through a
specific three candle sequence that forms a swing High showing strong rejection from a key level this sequence consists of an Impulse candle is a strong move that takes liquidity or manipulates price a rejection candle which is a sharp rejection with a long Wick eventually a confirmation candle which closes in the opposite direction confirms that smart money has taken control and that the price is now reversing once all these conditions are met the entire upper Wick of the middle candle becomes our bearish rejection block the same concept applies in a bearish scenario where the three candle
sequence forms a swing low instead in some situations the confirmation candle's Wick may be longer than the rejection candle's Wick in this case the longest Wick should be considered the rejection block just like IFC candles and inverse fair value gaps the 50% level of a rejection block acts as a crucial support or resistance Zone this level often becomes a high probability area for Price reactions making it valuable for entries and risk management now let's break down the key characteristics of rejection blocks and see what factors we need to take into consideration in identifying them the
first factor that we need to look for is strong Wicks this Wick shows that liquidity was taken from that area but smart money rejected the move the larger the wick the stronger the rejection if price touches a key Supply Zone and then drops rapidly without consolidation this suggests a rejection block is in play the second key characteristic that we should take into consideration is the sharp reversal after rejection price moves aggressively in the opposite direction often without hesitation this indicates that institutional orders were filled and price is now following their intended Direction the speed of
the reversal confirms that retail Traders were trapped and the market is now moving efficiently the third factor is smart money activity so you know the rejection block isn't just a random reversal and most of the time it coincides with smart money Activity one of the ways for determining such activity is an unusual surge in buying or selling volume because a spike in volume confirms institutional involvement and signals that large number of orders have been executed at that level this confirms that smart money was active in absorbing liquidity and reversing price if price spikes above a
key level but closes with a long Wick and volume surges this confirms smart money activity now let's see how rejection blocks can be utilized to manage a profitable trading strategy and execute trades effectively but before we continue you're an experienced Trader looking forward to getting funded register with our trusted prop firm funded next funded next is one of the top rated prop firms on trust pilot that provides one of the lowest spreads and commissions in the industry they offer a variety of plans for Traders with unique services including a 15% profit share from The Challenge
phase and a 10% profit Target with no time limit if you're seeking a prop firm that genuinely supports your trading journey and provides financial needs register with the link in the description imagine the price has created an un mitigated rejection block on the higher time frame by sweeping liquidity below the latest demand Zone and strongly rejecting from that area eventually forming a valid rejection block our next approach is to monitor price action and wait for the price to return to the rejection block area once the price Taps into the rejection block we should quickly switch
to a lower time frame to analyze price action closely looking for reversal signs and potential entry opportunities once a market structure shift is confirmed we identify a lower time frame PD array to open a position in this case a buy position this PD array could be a fair value gap an order block a breaker block or a mitigation block you have two options for takeprofit levels Target the nearest draw on liquidity on the current time frame or aim for the higher time frame draw on liquidity for larger potential gains or you can use any other
entry models that we have already covered in previous episodes like using inversed fair value Gap as entry point or using candle breakout entry model if you more up to use single time frame to execute trades the specific type you choose depends on your trading model and preference but make sure to watch previous episodes to understand them now let's proceed to the real chart and put them all together and see how to use them to execute trades using rejection blocks here we have Euro 30-minute chart displayed on the screen as you can see the Market's overall
profile is bearish since the price has created multiple bearish breaks of structures to the downside take a closer look at the chart you'll notice that price after sweeping the cell-side liquidity below this swing low it quickly moved upward with strong momentum toward the supply area it then pushed through the supply Zone grabbing buy side liquidity above it before completing the manipul ation phase following this the price faced a sharp rejection in the opposite direction leaving a long upper Wick and aggressively moving downward this move also led to a market structure shift on the lower time
frame and eventually a bearish break of structure the upper Wick of these candles represents a rejection block signaling that smart money has actively entered the market so we have a valid bearish rejection block with strong potential to rever verse the price making it a perfect selling opportunity our next step is to wait for the price to tap into this rejection block once the price enters the unmitigated rejection block I'll zoom into the 5- minute time frame for a clearer view of the price action and to identify a suitable entry point for a short trade now
with the 5minute chart on the screen you can see that once the price touched the exact 50% of the higher time frames rejection block its bullish momentum weakened and it got rejected in the opposite direction this perfectly validates the importance of the 50% level that we discussed earlier the next step is to patiently wait for the price to form both a market structure shift and a 5-minute PD array or an inverted fair value gap before placing an entry let's see what happens next as you can see the price has created a market structure shift by
breaking and closing below the latest swing low additionally it has violated this bullish fair value Gap and closed below it this Gap is now more likely to hold and act as a resistance area providing another Confluence for a potential reversal since the price closed below the CB fair value Gap this action creates an inversed bearish fair value Gap with these confirmations we anticipate that the price will return to the inversed fair value Gap Zone before continuing its move toward the sell-side liquidity next for placing an entry I'm going to set my sell limit order at
the midline or consequent encroachment level of the inversed fair value Gap my stop loss will be placed just above this swing high for takeprofit we have two options Target the closest 5minute cell-side liquidity which is located here or Target the 30-minute time frame's sell-side liquidity which is over here I'm opting for a more aggressive approach by targeting the 30-minute time frames swing low offering almost 6 to1 risk to reward ratio now let's play out the trade and see what happens next as you can see the price pushed higher tapped into the inversed fvg which acted
as a resistance Zone and triggered my sell order afterward the price reversed and moved downward with strong momentum eventually it successfully reached the take-profit level confirming the effectiveness of this trading setup now let's move on to another example to further solidify this concept here we have the euro dollar 4-Hour time frame chart on the screen as you can see the Market's overall profile is bearish and now if we zoom into the 1-hour time frame we can see that the price has created a valid rejection block by forming a long Wick that swept the liquidity above
the previous major swing High it then immediately reversed in the opposite direction with strong momentum leading to a market structure shift since the Bears are the controlling side of the market and we have a bearish market profile we are looking for a selling opportunity to go short if the price Taps into the rejection block as the current price enters into the hourly rejection block I'm going to zoom into the 5 minute time frame here we can see that after tapping into the higher time frame rejection block the price reversed and formed a market structure shift
a additionally it created a breaker block represented by this down close candle the price formed a swing High then a swing low followed by a higher high before immediately reversing and breaking below this down close candle now we have the 5minute PD array that we were looking to go short I'm going to set my entry at the lowest point of the breaker block and set my stop- loss a couple of Pips above this swing high for the takeprofit I'm aiming for the sell-side liquidity below this swing low offering about a 6:1 risk to reward ratio
now let's see if our trade plays out successfully or not as you can see my order has been triggered and price pushed lower with great momentum and eventually hit the TP that's it Traders thank you for watching this video I hope you found it informative and useful don't forget to hit the Subscribe button and turn on notifications to stay updated on our latest videos we value your feedback and suggestions so please leave your comments below and let us know what topics you'd like us to cover in our future videos we appreciate your support and look
forward to seeing you in the next episode