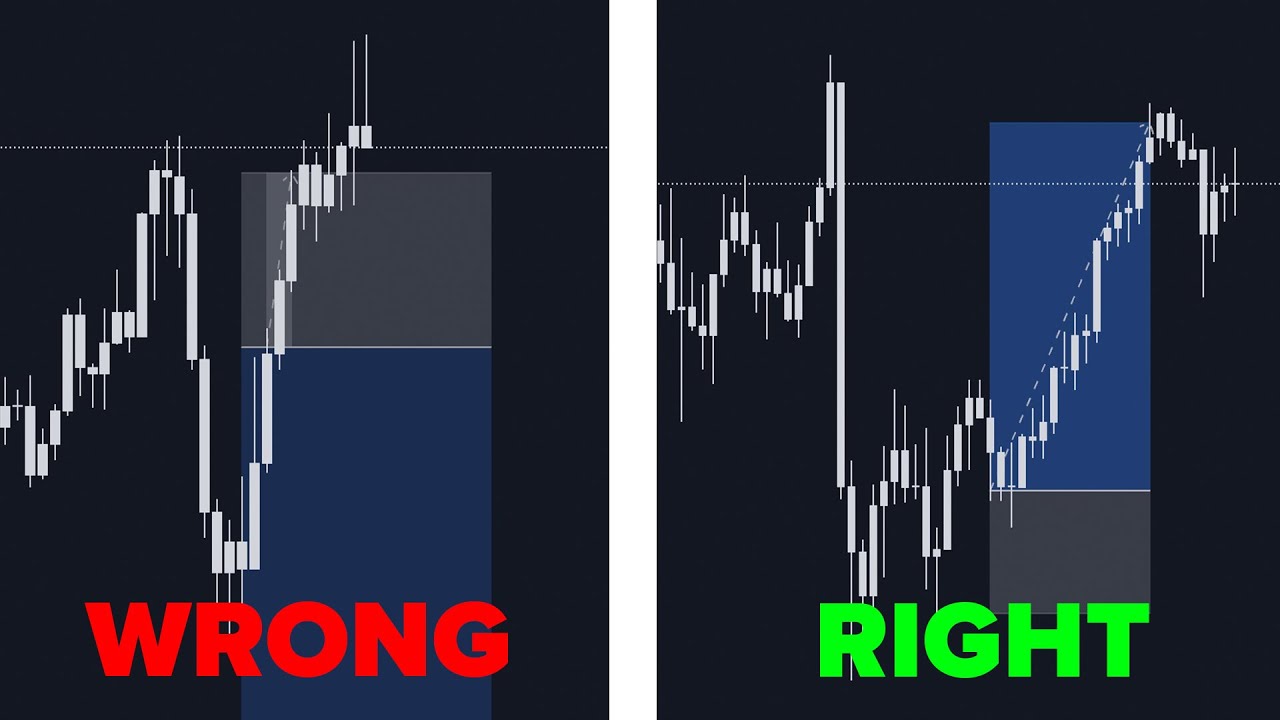
I've helped a complete stranger make $1,000 per day as you can see here this student of mine posts wins almost every single day up to $1,000 per win now if you want to do the exact same thing I'm going to be breaking down for free my complete trading strategy this is exactly how you can do the same thing so make sure you watch until the end of this video first things first every single trading plan needs four things it needs a bias tool a structure tool A Trading Zone tool and an entry method so what we're going to do in this video is go over each of those things individually and then we're even going to discuss some psychology so first of all a bias tool what is my bias tool so I like to look for my daily bias sometimes I look for weekly bias but typically it's just daily bias so how do I identify my daily bias so I like to look at two things so first we go to the Daily time frame and look at the previous daily candle and then we look at the previous 4our candle as well so if the if the previous daily is bearish and the previous 4 hour is also bearish then the bias is bearish If the previous daily is bullish and the previous 4 hour is also bullish then the bias is bullish and I'll only be looking for buyers if they're mixed we prioritize the daily but typically we can trade in other direction it's like if the daily is bullish and the 4 Hour is bearish then we want to be looking for buys but if sells make sense like there's an external fair value Gap or something like that then we can look to take sells as well um but typically we look at the previous daily candle and the previous 4-Hour candle to determine our bias for the day so if we do that right now you can see that the previous daily candle is in fact bullish strong bullish we've been bullish for quite a while now so if we look at the previous daily candle you can see that that is in fact bullish which means that either way we're going to be prioritizing buyers today but if we go to the 4our time frame and see what's been going on there you can see that the previous 4-Hour candle is also bullish if I just draw a circle around that you can see that this means that the daily bias is in fact bullish why because the previous daily candle is bullish and the previous 4our candle is also bullish which means that the daily bias is strongly bullish so we're going to be looking for buyers today now that we've got the buyers tool out the way we now need to talk about trading zones or specifically support and resistance or even more specific fair value gaps and liquidity because that is exactly what I trade so what we're going to do is we're going to go over fair value gaps first and then we're going to go over liquidity and then we're going to go over how to pair these two things together so let's do that right now so a fair value Gap is made up of three candles there's obviously the first candle then there's the second candle and then there's the third candle sounds pretty self-explanatory but with the second candle this is what's known as the expansion candle expansion candle which means that this is the move this is what determines the direction of the fair value Gap the first candle can go in any direction the second candle can go in any direction but this will determine the way the fair value Gap goes and the third C can also just do whatever it wants pretty much so for a bullish fair value Gap all we need is a bullish expansion candle for a bearish fair value Gap all we need is a bearish expansion candle so if we look here you can see that there is a fair value Gap right here but what direction does it go in to help us identify this we're going to look at the first candle which can go in other direction the second candle and then we're going to look at the third candle so the first candle right is bullish doesn't really matter what direction this goes in but as you can see it is bullish the second candle is bullish and the second candle is the expansion candle and this decides whether or not at fair value Gap is bullish or bearish and the third candle is bearish but that does not matter as well so if we just focus on the second candle you can see that that is in fact bullish which means that the fair value Gap is bullish so we've got a bullish fair value Gap right here but to make sure it's a valid fair value Gap we want to check that the Wicks do not overlap so with with the expansion candle you want to make sure that the Wicks that pass through it do not overlap which means that the top Wick of the first candle mustn't overlap with the bottom Wick of the third candle and as you can see right here they do not you draw a line at the top Wick and a draw a line at the bottom Wick and that is your fair value Gap and to actually draw it you take a box you drag it from the top Wick of the first candle and take it to the bottom Wick of the third candle and then that is your fair value Gap that is that that is a bullish fair value Gap why because the expansion candle is bullish the top rck of the first and the bottom Wick of the third candle do not overlap so this is a valid bullish fair value Gap now how do you actually Trade Fair Value Gap so what you want to do is you want to wait for price to come back into this area this Gap this fair value Gap and wait for price to show signs of respect there's two things price can do when price comes back to a fair value Gap it can either respect it or it can disrespect it if it disrespects it then the fair value Gap becomes inverted which means it's inversed and you know we'll get into that at a later date but what we're going to do now is we're just going to look at how price reacts to this fair value up when it comes back down to it so as you can see right here price came back into this fair value Gap over here reacted to it respected it and then continued up now I would have entered my trade position if I was trading on the 15 minute right right here I to put my take profit up here something like that my stop loss just below here something like that now we're not talking about entries here what we're talking about is fair value gaps so if we just look at this you can see that price creates the fair value Gap we've gone over why it's valid then it comes back to the fair value Gap as you can see it Wicks it and completely respects it when this candle closed I would have got got in for my entry and that is how you would enter trading fair value gaps in this video we do not need to go over inverted fair value gaps or inverse fair value gaps or we need to go over un normal fair value gaps so what we would do is for a fair value Gap we would look for these threee candle specific format so it's the top Wick doesn't overlap with the bottom Wick of the third candle and that's your thir value Gap um and then you wait for price to come back to it respect it and take your entry there now liquidity what is liquidity so so there's two types of Traders there's institutional Traders and there are retail Traders institutional Traders are people with lots and lots of money typically big Banks you know Barkley's Lloyds HSBC um JP Morgan all of those places they're institutional Traders cuz they're one they're institutional but two they have lots and lots of money now retail Traders think of it like retail shops like you go to the shop it's quite cheap cheap um that's retail um and you buy what you need and then you go about your day whereas these people do it for a living typically now retail Traders these have less money than institutional Traders institutional Traders have more money than retail Traders so for retail Traders for me to enter my one lot position does not really matter 10 lot position even does not really matter but for institutional traders to enter their 100 100,000 may maybe a thousand lot position they have to have a lot of liquidity this means that basically we have as retail Traders as a as as a collection we have a lot of volume to trade with we have a lot of liquidity to trade with we don't do much damage when it comes to liquidity whereas institutional Traders placing their trades they have a lot of liquidity to take and they need to take a lot and sometimes what happens is there's not enough liquidity so how Forex Works basically is if I want to buy 10 Lots then there has to be a collection of someone selling 10 Lots now this can be one person or it can be 10 people selling one lot or it could be five five people selling two lots whatever it is it has to come to 10 there has to be 10 Lots being sold if I want to buy my 10 Lots yeah now that works every way around so if you enter in a sell position there has to be 10 Lots being bought but what happens with the institutional Traders as we've just discussed is that they don't have enough liquidity to fill their positions all the time like they'll be looking to buy 1,000 Lots maybe something stupid like that which is like millions and millions of dollars sometimes there might just be like 800 Lots being sold and they want to buy a th000 so they have to make that extra 200 to make that 1,000 lot position yeah so how do they make this 200 Lots let's just drag this over here making sure this is still easy to follow they have to find 1,000 lots to fill their buy or sell position there's only 800 they need to make 200 how do they do that so Forex is a zero sum game as we've just discussed if you're buying then someone else must be selling and to get into the markets you have to buy to get out of the markets you have to sell if you take a buy position regardless of what direction it is if your stop loss gets hit or your take profit if you take a buy position you will be getting out with a sell order now this can be a limit order or you know a live market execution but typically well no 100% of the time a stop loss or a TP order for a buy position is always a sell order if you buy one lot to get out of that trade you have to sell one lot simple as that the profit is the difference in price that's it um now this means that when you take a buy position and you put your stop loss somewhere you've got a sell order right there which means you're going to be selling your position when price reaches that level so if you get in through a position with one lot and place your stop loss to close the entire position that means that you've got a stop loss for one lot somewhere wherever you've placed it there's one stop loss now what happens with the retail Traders is they typically have the same stop-loss placement like all of us have the same stop- loss placement typically so what will happen is institutional Traders will Target that stop- loss and also pending orders which we'll get into in 1 second so with the stop- loss they will Target the stop loss to generate the liquidity now how does that work so let's say that they want to buy institutional Traders want to buy okay let's say they want to buy now that means that 1,000 has to be being sold but there's only 800 so they have to get 200 lots to get sold so how do they do that well they can see with the footprint charts we don't need to get into that but they can see and also guess that there is a lot of stop losses below this low here a lot of stop losses below this level right here so what they're going to do is they're going to Target that stop loss or that area which will execute two things one the stop loss for the people that are currently in the buy position which will generate 100 let's say 100 sells because they sell orders to get out of that position they will trigger 100 stop losses and because price is going down there's going to be those idiot Traders the 99 9% which you're not going to be at the end of this video that will also execute sell positions because they think price is going to continue down let's say that's another 100 so they've executed limit orders and Market orders as well they've executed stop losses which will be people buying the market which is what they want to do they'll target the people who are already in the buy position they'll Target their stop loss which will generate sells side liquidity because they're selling the market and they'll also get people into their sell positions to generate more sells side liquidity yeah simple as that so with that sells side liquidity which would be 100 and 100 here that generates the 20000 cell side liquidity which they need to add to the 800 currently available which will equal a th000 so they want to buy 1,000 Lots but they can only buy 800 Max so what do they do they target people's stop loss to generate liquidity in order to fill their massive positions and that is how liquidity works that is the metrics of liquidity now you should understand how liquidity works it is institutional Traders targeting certain levels where there stop losses and pending orders so that they can fill their positions now that you understand that we can now discuss where liquidity is resting liquidity is resting in like four places so there's four main places there is equal highs and equal lows which we're going to discuss in in a second and there's also previous highs and previous lows now in a move up price will always Target buy side liquidity and in a move down price will always Target sells side liquidity so as you can see here we've got sells side liquidity right here we've also got buy side liquidity over here what happens price then breaks this low here takes out this liquidity then has a nice move up to this area over here taking out this liquidity now think about now this this is how it works this is a live example so let's say you're in a buy position yeah you get in a buy position over here where's your stop loss going to be it's going to be here take profit might be up here doesn't really matter your stop loss is going to be over here now that so they take out your stop loss then get in their buy position anyway and when you get in when they see this when this move happens what's going on is people are also selling okay we've just broke this low so we're going to enter our sell position here where's our stop loss going to be previous high oh look the stop loss gets took out and then we continue down but what's going on again is prices oh yeah price is going up all these stupid retail Traders are like oh yeah let's get in for a buy position right here cuz we just took out the highs where's our stop loss going to go the lows look what happens price targets the lows but then has a nice massive move up anyway that is how it works price will be manipulated by the institutional traders to generate liquidity in order to fill their massive positions that is why what it is so as you can see here we've got liquidity at the lows liquidity at the lows liquidity at these lows and the highs as well we've got highs here highs here highs up here here you know here like every single high is where liquidity is every single low is where liquidity is as well and it also happens in equal lows and equal highs and it also happens in equal lows and equal highs and this can be in the form of consolidations or it can be in the form of just equal highs and equal lows like dotted lows double bottoms and double tops um there's liquidity right here there's also liquidity over here over here like every single high every single low and that's pretty much it like it's pretty self-explanatory once you understand it it's pretty straightforward but what we want to be doing here is when price takes out one side of liquidity we want to take out the other side of liquidity now there's names for both sides so at the highs all the highs is buy side liquidity this is buy side buy side why why because people in sell positions are going to have their stop losses above these highs and there's also going to be pending buy orders ready to get in for a buy position um to try and catch a nice move up so there's buy side liquidity at highs because that's where sellers stop losses is and to get out of a sell position you have to buy and with the lows that is sell side liquidity why because people who are buying the market have their stop loss there and there's also pending sell orders in the form of executions why because price is going down price thinks price going to continue down and also if you're buying you have to sell to get out that is how liquidity works that's it like what you want to do is when price takes out one side you want to Target the other side simple as that so when price obviously you have to pair that with other things you don't just do that purely and it works every time cuz it Doesn't in ranging markets it might work but in moves up and down it won't work work because when we're having a nice move up on a lower time frame we are generating all of this sells side liquidity which obviously eventually gets took but as you can see that would not work on this time frame we would only be targeting buy side but in a ranging Market you can do the same thing you can Target take out sell side Target buy side take out sell side Target buy side but when you pair with other things so if you're looking for buy positions and we take out sell side then you can get a buy position there you can have a nice move up as you can see right here we have sell side liquidity right here we take that out and then we start continuing up so I would enter my cell position obviously with other confluences I would enter my cell position somewhere like around here now I'm going to be showing you how to pair this with fair value gaps so what you want to do with fair value gaps is you want to basically use the fair value Gap as your entry and use liquidity as your exit so we have a fair value Gap right here because we have 1 2 3 we have a bullish EXP expansion candle right here and the Wicks do not overlap so this is a valid bullish fair value Gap correct now how do we trade this so we wait for price to come into it and then respect it so we just take our buy position right here with our stops just below here and where do we target well what we can do is we can decide where we can Target so we can either Target here we can Target the internal liquidity or we can Target the external liquidity we have targeting internal liquidity right here we can just Target previous high so we can get in when price is respecting this for Value up even here if you wanted to like you could really I would probably get in here then you can just Target this up here simple as that a nice one to n 1. 9 R simple trade easy trade stupidly easy to be honest with you um and that's that's as simple as it gets now to actually draw liquidity you want to get a line um hover of like a trend line so if we just go over to the left hand side hover over this it should say um trend line tools you click the arrow highlight trend line click favorite it should pop up here then you want to draw it out you want to go to edit settings text put the dollar sign in click save as save as and then it should say like liquidity then save and then it should appear here so you click liquidity and then it is there simple as that so now you can actually draw liquidity um but that's what you want to do now there's obviously two things we're not going to get into this yet um I'm going to make a video on this in the future but there are two things it's called internal liquidity and external liquidity we're not going to worry about that yet all we need to focus on is liquidity as a whole but I've shown you fair value gaps and I've just showing you liquidity so now we have our Trading Zone so I would identify my fair value gaps and then I would identify my liquidity and I'd look to trade to those things but now we need to pair this with a structure tool so what is my struct structure tool my strategy revolves solely around AMD so what we're going to be doing now is going over AMD in complete depth so what is accumulation accumulation is the buildup of long and short positions simple as that there's equal highs and equal lows that's what it is it's a consolidation and there's buy side liquidity over here and sell side liquidity over here liquidity on either side this is the buildup of positions now this will typically happen during the Asian session which you can if you want to find out what the Asian session is just search it up very straightforward it's like 10: p. m.
BST to 7:00 a. m.



![BEST MACD Trading Strategy [86% Win Rate]](https://img.youtube.com/vi/rf_EQvubKlk/maxresdefault.jpg)