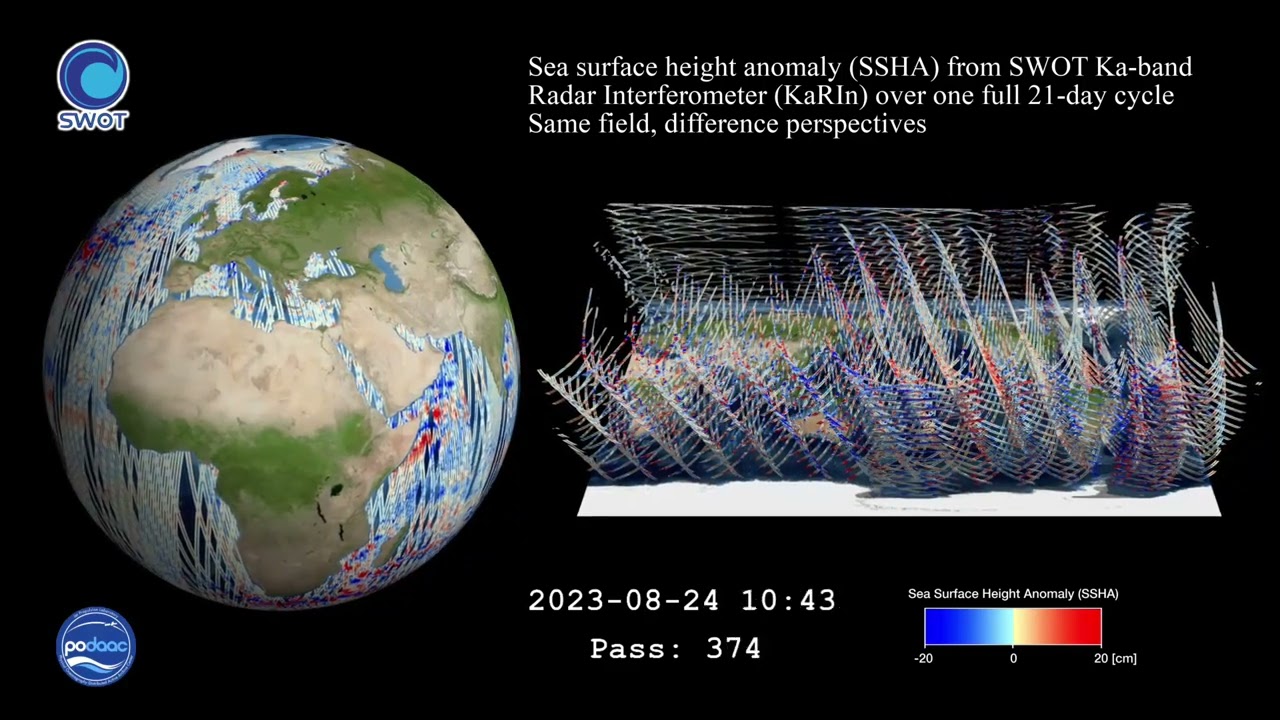
Hamlin pavelski I'm a professor at the University of North Carolina at Chapel Hill and I'm NASA's hydrology science lead for the SWAT satellite Mission and I'm here to tell you about hydrology data products from the SWAT Mission so if you're here I'm guessing you might have heard about the swap Mission already but I want to tell you just a little bit more about it to make sure we're all on the same page before we start so SWAT stands for the surface water and ocean topography mission SWAT satellite uses interferometric radar technology and it's designed to
measure two things to measure where water is so inundation extent and what the elevation of water is so water surface elevation and it's designed to do that in the in the world's uh lakes rivers and oceans it launched on December 16th of 2022 um we get observations H something like every 10 days but it really varies a lot depending on where you are globally it covers most of the globe unless you're interested in key parts of the Arctic and Antarctic our goal is to have data out to you uh within uh three days of when
it's collected we're hoping that it lasts for longer but it's supposed to be a three and a half year Mission and importantly it's a it's a partnership between NASA Kess the French space agency with additional contributions from the Canadian space a agency and the UK space agency if you look at the figure on the right you can see a mockup of SWAT and essentially every time SWAT passes over it's flying along uh the brown line in the middle and it's collecting uh its primary data sets over the two brown swads one on either side and
if we think about swats fundamental measurements it's really collecting data on two things the first thing is what we call back scatter and this is essentially the amount of energy so SWAT sends a radar pulse out and it's measuring the amount of energy that returns to the satellite and we can use this information to help us estimate where water is because SWAT is designed to have highback scut over water the second thing it measures is what we call phase and this is a little bit more complicated I'm not going to get into it in too
much detail here but the important thing to know is that I essentially it's a form of timing measurement and we can use it to estimate or measure water surface elevation based on differences in this phase between two antennas um in terms of when the uh the signal returns and this is based on uh radar interferometry or the interfer interferometric measurement concept so if you're a hydrologist and you're interested in using data products I'm guessing that you're not super interested probably in the Raw Back scatter and phase you might be more interested in something like water
surface elevation or inundation extent so how do you get that information so it turns out that we have eight different data products that are provided by the mission um that are specifically designed to help with hydrology and I'm not going to go through all of these today because some of them either um are auxiliary data products or are not yet available so I'm going to focus on just four of them the pixel Cloud the river single pass the lake single pass and the raster data product and you can see two of those um in the
figure on the right here the lake single pass and the river single pass so let's start with the pixel Cloud product so this is an example of what the pixel Cloud product looks like and this is the rawest Geo reference SWAT data so if you're looking at any raw or data you have to do it in radar coordinates and maybe that's something that you want to do but if so I bet you already know how to get your information so the pixel Cloud it looks a little bit like a lar Point Cloud so if you
if you look at the figure on the left this is uh over part of uh the Owens Valley in California and the Sierra Nevadas uh you can see that each one of these pixels represents a place where SWAT thinks there might be water and the color represents elevation so yellows are higher and purples are lower and if you look at the zoom in um this is of a a reservoir down in the valley and you can see each of these individual little dots and each one of those dots has an associated in inundation extent a
water surface elevation a bunch of quality Flags Etc so the pixel cloud it's represented as a point Cloud it's stored in a net CDF format the granules uh cover essentially one side of that SWAT swath so they're 64 about 64 kilometers by 64 kilometers and I will say that these are relatively large files so there's something like a gigabyte per granual or they can be that big and so this might not be the product for you if you want to study something globally but it might be the product for you if you want to design
bespoke algorithms on relatively raw SWAT data I will also say that the pixel cloud data is where we start from for a lot of the other data products so let's move on to our next data product and think about rivers so the SWAT River SP or single pass data product starts with the concept of a river and I want you to imagine that this Carolina blue stripe here is a river and we start with uh essentially SWAT overpassing and it's collecting something that looks like the pixel cloud data so that's all of these black dots
and what we want to do is we want to take this pixel cloud data and organize it in a way that would make sense for studying a river so the first thing that we do is we aggregate uh all of those pixels onto a Center Line a predefined center line and I'll talk a little bit more about this in the next slide and we divide that center line up into about 200 met long chunks that we call nodes and each one of those dots gets Associated to its closest node and then averaged and then we
aggregate a whole bunch of nodes about 50 of those nodes into reaches that are about 10 kilom in length so the L2 HR River SP product is a vector product it's in shape file format and you have two options you can download download a reach option which contains data on these about 10 kilometer reaches represented as polylines or you can download the node product which provide which is a a sort of a finer resolution product that's represented as points and either way each one of these is going to include information on water surface elevation inundation
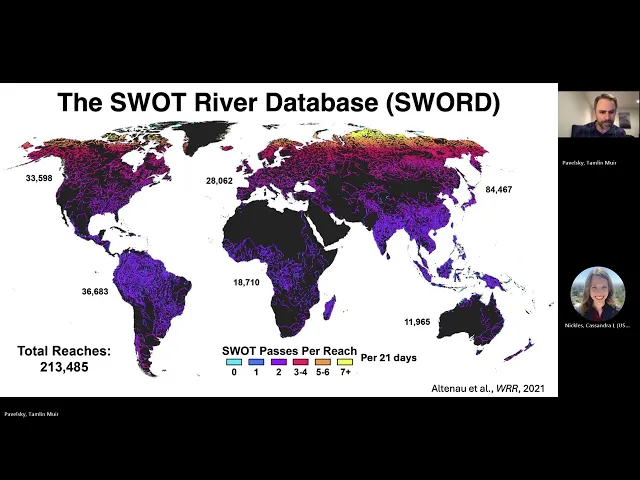
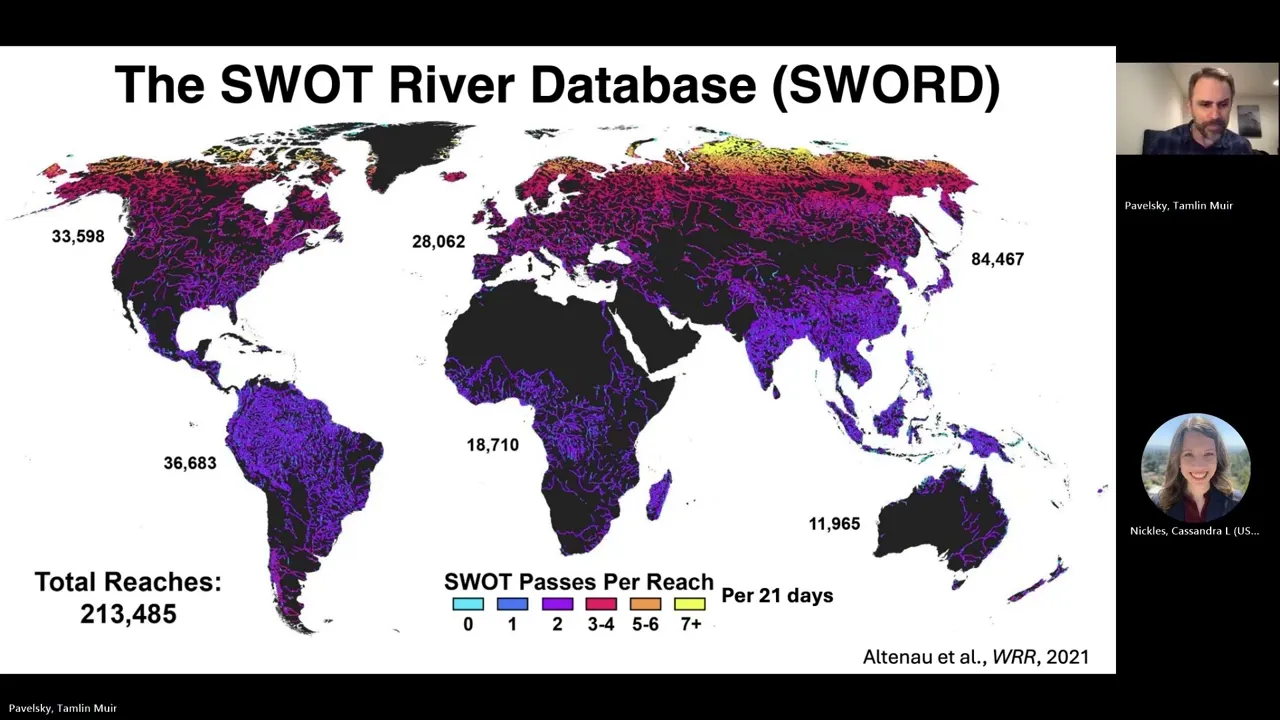
extent reaches will include information on slope there will be information on quality Flags Corrections Etc and I'll show you an example of this in a minute but one grand Manual of river SP data is going to represent one SWAT overpass so those two swads um passing over one continent so let's take a look at some of this data and what it might look like um but before we do that let's think about where we're collecting this data or or or what rivers we're looking at so this is the SWAT River database also called sword and
uh so we've got about 213,000 uh reaches worldwide and each one of those reaches contains on average something like 50 nodes so you can do the math on how many nodes we have but it's a lot and uh so you can go and download Swat data for nearly any of of these reaches um or nodes globally so now let's take a look at what uh this data looks like so this is an example of one SWAT uh uh River Vector pass over South America from March 14th of 2024 you can see that it's covering part
of the Amazon and uh down into the Andes and up into uh into Venezuela and you can see all of the individual Rivers there colored by elevation if we zoom in a little bit um on just one of these Rivers you can very clearly see uh the slope of this River you can see that it's higher to the South and it's lower to the north this is exactly what we would hope for with SWAT and if you zoom in even a little bit further on this you can now start to see individual nodes in this
River so we're looking at the node data product here and so you can see these uh these little dots are nodes and a lot of these nodes behave exactly the way that you would expect there are some that might look like outliers sometimes we do have errors in swat data but mostly this looks just like what we would hope for in swat data okay so that's Rivers what about Lakes so just like for for uh rivers with with sword we have a a Prior Lake database and uh we've got about six million lakes that we're
hoping to observe with SWAT and so just like for Rivers we have a vector a set of vector data products for um for for this uh Prior Lake database as well representing SWAT data so let's talk a little bit about what those are so this is a little bit of a complicated figure but it's also important so if you go and try to download Swat uh Lake SP data you're going to see that there are three different kinds of files there's lak Spore OBS lak Spore prior and lak Spore unassigned so the difference between OBS
and prior is the important one I'll get to unassigned in a minute so the upper left panel of this little figure shows um what we have observed with SWAT for example uh a lake boundary in solid lines and what the Prior Lake database represents in dash lines and so you can see that sometimes the topology of these Lakes is different right so in this Lake over here SWAT is seeing this is one Lake the the plld sees it is two over in this Lake SWAT sees it as two different lakes and the plld sees it
sees it as one so if you decide that you want to go with the observations then we're going to be representing this as one but this Lake over here on the left is one polygon and the one on the right is two polygons If instead you want a Time series for every Prior Lake then you probably want want to go with the prior and in that case you're representing the lake on the left as two different polygons and the one on the right as as one polygon with with sort of two parts to it so
the third one Lake un assigned is essentially anything that isn't in the Prior Lake database that we think even conceivably could be a lake gets put in here I will say um if you take a look at this you will see a lot of very interesting things and many of them are probably not Lakes but some of them are so it's it's sort of a uh a holding uh Pond for for features that we might want to add to the Prior Lake database in the future so just like for Rivers one past represents uh or
one granu represents one Passover one continent and uh this uh data product also includes information on water surface elevation inundation extent quality flags and Corrections so if we look at an example this is an another example for some lakes in uh Peru and uh in high in the Andes in South America you can see all of these polygons that represent Lake boundaries and they're colored by the elevation of the lake and so this is if you go and download I believe this is the observe product if you go and download the observe product you will
see something that looks a lot like this okay so the last data product that I want to talk about is the raster data product and this is the one that might be most familiar to you if you're used to to working with satellite data because it's a nice even uh raster and the way it's stored it's in a it's in a UTM projection we have two native resolutions for it 100 MERS and 250 M it's on a geographically fixed grids so from uh past to pass you should be able to compare uh individual grid cells
it's stored in a slightly different form format than the um pixel cloud is it actually Aggregates two by two like a 2X two square pixel Cloud tile so it's 128 by 128 and it's stored as a net CDF um with each rasterized layer as it's uh as its own layer in the net CDF so if we look at what's uh um this looks like this is for an area over Colombia a wetland area um you can see uh this is just an example of the water surface elevation that's recorded in in the raster product and
I would say that the you can use the raster product for many things it's particularly good for places in areas that are not well represented by polygons so this is a big uh Wetland complex where the the extent of the Wetland can change dramatically over time it's probably not something that polygons represent very well and so this is a place where you might want to consider using the restor product okay so I've just given you a really quick rundown of these data products where do you go for more information so the first place I would
go is to podac on the physical oceanography deck which uh stores uh all of the SWAT data you can get a product description document or an algorithm theoretical basis document for any of these um different data products here I just scan the QR code or go to the link that's provided down at the bottom here I strongly recommend it if you're going to use um all of this now what if you're relatively to swat and you just want a place to start so where should you start you should start with the SWAT science data product
user handbook so this gives a fantastic overview of how the whole mission works it talks about um all of the data products some of the sources of error it tells you about um some of the pitfalls that you might run into so if you go and actually look at this document in detail before you start your analysis you are going to solve so many problems that you're going to run into otherwise your paper review is going to go so much better everyone who uses SWAT data should have read this uh uh this handbook so I
strongly recommend that you go and take a look at it before you you download your SWAT data so what are my take-home messages here SWAT has a variety of data products a lot of which don't look that much like other NASA data products it can be used to track water levels in rivers lakes and actually we didn't talk about it too much except for with the rasp but also in some Wetlands my recommendation is to read the user handbook and other documentation before you use the data and you can public you can download the data
uh if you are um if you are listening to this right now you can download the data either from NASA or canas at the two sites listed here so thank you very much and go SWAT