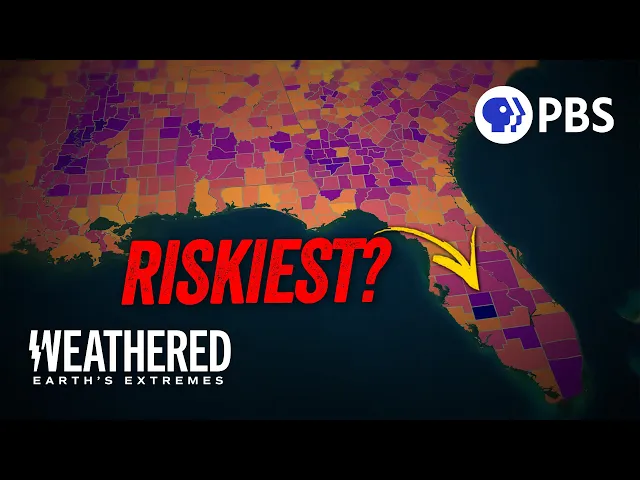
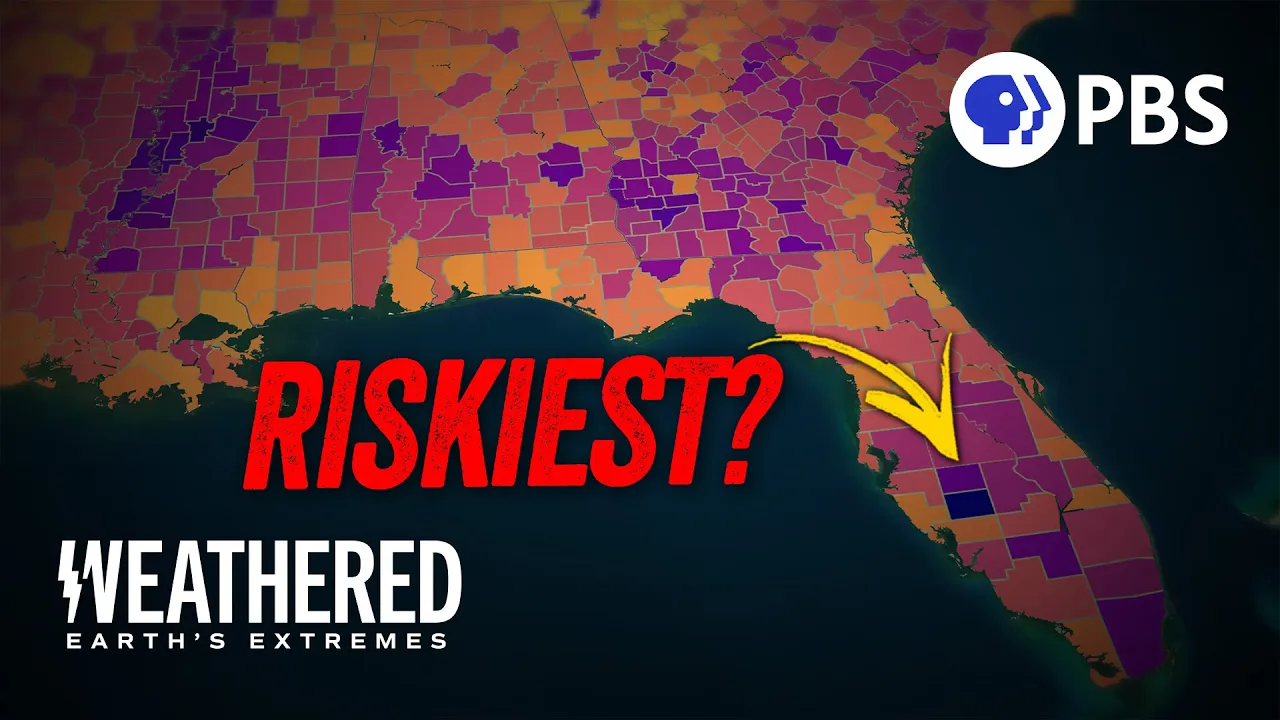
All right. We're here in Atlanta, my hometown, and we're getting ready to talk to one of my favorite climate scientists about what areas in the United States are most vulnerable to climate change, and this is one of them. Dr Marshall Shepherd and his colleague, Dr Binita KC, created a risk map of the United States that combines three big variables-- hazards, exposure, and vulnerability.
The hazards they modeled include heat waves, cold spells, extreme precipitation, and drought. Maiya: So how do you define exposure? So, exposure is what people, or infrastructure, or resources are actually being impacted by an extreme heat event or a drought or an extreme rainfall event.
If your eye homes in on this map, you see urban spaces. Maiya: We're in Atlanta, and, I mean, this is metro Atlanta. Clearly.
Miami, southern Florida, parts of the Southwest and L. A. and so forth.
So what that conveys-- that these are places that have a lot of stuff and have a lot of people. And the last variable is vulnerability. Yes.
So how do you define vulnerability? One of the things that we know is that the most vulnerable parts of our community are communities of color, elderly, children under five, and the poor, irrespective of color. And so that's what this captures.
So one of the things that immediately jumps out to me is this region in the south of purple-- high vulnerability. That's the well-known Black Belt of the South. You also see areas of vulnerability in Florida that are likely tied to the elderly community that tends to retire in Florida.
Before we dive into the results of this map and learn what areas are most vulnerable to climate hazards, I wanted to explore how the models predict these extreme events will change as the climate warms. One of the most obvious changes--temperature. So, with global warming, we're seeing not only increases in average temperatures, or baseline temperatures, but also in extreme temperatures.
So we're seeing unprecedented instances of record-breaking heat. Maiya: The Southeast and Southwest already experience extreme heat, but that heat is gonna get a lot worse in the next 30 years, with parts of Louisiana, Texas, and Florida experiencing over 100 days reaching over 100 degrees a year, and days over 125 degrees used to be virtually non-existent, but by 2053, large areas of the country are expected to have at least one day a year reaching that incredible extreme. And at that temperature, a prolonged power outage could cause mass mortality.
J. Marshall Shepherd: We should not be surprised by the warmest summers on record, the warmest winters on record, or warmest year on record. I think we'll see that story over and over and over again.
Maiya: If you Google "climate change," you get images of polar bears on melting sea ice, and you get images of drought. A lot of people assume that a warming world means less water. But as I've learned from talking to experts throughout the series, the future of precipitation is a lot more complicated.
In fact, for every degree of warming, the atmosphere holds 7% warm moisture. With the exception of the Southwest, much of the country is expected to get wetter on average, but it's often the extremes that impact people in homes. A 2024 study showed how extreme precipitation events are expected to get worse as the climate warms.
53 million people currently live in high-risk areas, but that number could double with two degrees of warming. Daniel Swain: And so what we see is that the atmosphere not only can produce more extreme precipitation events but can also result in more intensive or faster evaporation when there's moisture available to evaporate. Maiya: So that means both more rain and more drought, and while they are more difficult to model, hurricanes and wildfires are causing catastrophic damage in our warming world.
In the last decade, wildfires have caused hundreds of billions of dollars of damage across the West and parts of the Southeast, and hurricanes have devastated coastal communities. And sea level rise will be a big threat along the whole Eastern Seaboard and the Gulf Coast. But, of course, we don't all experience these hazards equally, and that's exactly what Marshall wanted to show in his climate-risk map.
The areas that are popping out to me--obviously, Florida. Exactly. California.
Yup. The Gulf Coast. Gulf Coast.
Let's talk about Florida first. Very vulnerable to sea level rise, very vulnerable to heat, but also an elderly, aging population as well. There's an envelope of temperature humidity that human beings are comfortable living in, and when we get outside of that, it causes heat risk and potential death.
We are seeing days or even weeks where temperatures and humidity combined are outside of that envelope of habitability for humans. In addition, too-- Remember that exposure term we talked about, not only the people but the infrastructure. This is sort of petrochemical alley, a lot of industry in here.
So when we bring that together, you get high risk. Maiya, voice-over: We know that the deserts, Southwest and California, are vulnerable to drought, extreme rainfall, and water scarcity. And extreme precipitation and flooding is also a big hazard in the densely populated northeast, but cities, Marshall found, were particularly vulnerable.
J. Marshall Shepherd: Let's use Atlanta. Let's break this down.
Extreme flooding is not just the function of what falls from the sky as rainfall, but Atlanta also has a significant urban footprint in terms of impervious surfaces. So what that does is when we get these more intense rainstorms, the rain falls, it doesn't infiltrate into the soil, it runs off rapidly into streams and creeks, and you get flooding. And those surfaces are hot.
And so they absorb heat and reradiate that at night, and we get the urban heat island. So in your opinion, what is the place that is most at risk? This is a very skewed scale.
It goes from 0. 5 to 20. So South Florida, parts of the mouth of the Mississippi near New Orleans, and Los Angeles County, they're screaming at us for help.
I mean, I love this map. It really drives home the fact that, I mean, adaptation and mitigation and resiliency is so important. Absolutely.
And it's gonna continue to be important. Because we're moving into the riskiest areas. Yeah, we're there.
We're living this map. [music] J. Marshall Shepherd: The map shows that climate variability and climate vulnerability is present in almost every county in the United States.
There's no safe haven to climate change, I would say.