Hey traders and welcome to another episode of Smart Risk. Today we're diving deep into a critical skill every trader needs. The ability to identify buyside and sellside liquidity in the market.
Liquidity zones are a hidden weapon institutional players use to manipulate market sentiment. One of the primary reasons many traders face losses is their failure to identify and understand the liquidity zones properly. So in this advanced episode, we will explain the psychology behind these areas, candlestick patterns and price actions associated with them that you might encounter in the market.
We will help you to understand how they work and most importantly equip you with the knowledge to protect yourself from potential losses. So traders, if that's something you're interested in, please give this video a thumbs up to show your support and subscribe to our channel if you are new. See you after intro.
[Music] Welcome back traders. So let's get started. The sell side and buyside liquidity play crucial roles in the market's dynamics.
Price is most likely to move toward these zones in the market. Market always moves between sellside and buyside liquidity. Imagine it like a continuous circle where price moves either from sellside side to buy side liquidity or from buyside to sellside liquidity.
We can use these zones as a road map in our chart analysis and use them to our advantage to get one step ahead of the market and have more clarity on trades. Now let's have a quick breakdown of each one and see what is the psychology behind them. Imagine price entering into the accumulation phase as illustrated.
So here price has created equal highs and qual lows before starting the markup or markdown phase. If we look at this accumulation here, we see that we have a support at the bottom and also a resistance level at the top of the structure. It's obvious that retail traders are looking to buy when price reaches the support level and they also put their stop-loss below the support.
Hence, we have a great liquidity pool underneath the support level belonging to the stop-loss of the buyers waiting to be triggered by the market. Also, it includes the sell stop of the retail traders who are looking to sell if price breaks through the support level to the downside as they believe that if price breaks the support level, then it will start the markdown phase. In the same scenario on the buy side, when we encounter a resistance level at the top of the equal highs, we understand that many retail traders are looking to sell if the price reaches this resistance level, setting their stop loss above it.
Additionally, we anticipate buy stop orders placed by retail traders in case the price breaks through the resistance level with the expectation that the price will continue to rise after the bullish breakout. These series of actions create a well- definfined liquidity pool comprised of various types of orders awaiting to be swept by the market both above and below the equal highs and equal lows. So here we have the buy sell liquidity located at the top of the accumulation phase and also sellside liquidity which is located at the bottom of the structure.
Essentially they represent the same concept but they point in opposite directions. Buyside liquidity represents a level on the chart where buyers will place their buy stop and short sellers will have their stops positioned. And it is going to be on the buy side of the chart.
And the sell side liquidity is just the opposite. It represents a level on the chart where long bias traders will place their stops and short sellers will have their sell stop orders positioned. And it is going to be on the sell side of the chart.
Now let's see how the market reacts when reaches the buy and sell side liquidity. Let's say the price is moving towards equal highs and retail traders are selling as the price reaches the resistance level placing their stop- losses above it. Now if the price pushes upward and breaks through the resistance level it not only triggers the stop- losses of retail traders who entered short positions but also generates massive buying pressure as these short positions are recovered.
Additionally, it activates the buy stops of retail traders who are looking to enter long positions after the breakout. These actions result in a surge of buying pressure and create inefficiencies at the top of the structure, which may further excite traders to open long positions upon witnessing such a great increase in buying pressure in the market. Now, let's take a look at how the market operates.
But before we continue, if you're curious about how we stay updated on financial news and fundamental analysis, well, we rely on Fast Bull, one of the best trading websites with various useful trading tools. This site provides one of the most accurate and detailed economic calendar, a tool we use every day before starting our technical analysis. 247 economic live streaming also allows us to stay informed about the latest trading world's news and fundamental analysis.
So, if you want to benefit from multiple trading tools that can significantly improve your trading, make sure to check the link in the description. Each time a buy position is executed in the market, there must be someone on the other side willing to sell to fulfill the corresponding buy order and vice versa. Now, let's imagine that large financial institutions are interested in purchasing a currency pair with a large number of orders.
To do this, they require a significant number of sellers and corresponding sell orders in the market. This is essential because without available sellers in the market, no transactions can take place. Therefore, smart money needs to trigger the stop-loss and buy stop orders that are already present in the market to execute their buy positions in the market.
If the smart money intends to execute a large sell order, it requires buyers to participate in the market. This is because there isn't enough liquidity in the market for them to simply take the sell positions and there may not be enough buyers to fulfill all of the sell orders placed by the smart money. In such situations, it is often speculated that smart money may manipulate the market, creating scenarios that deceive traders into believing they have a clear understanding of price action.
This situation can create an illusion among retail traders, making them believe that they are trading on the right side of the market. However, contrary to their expectations, the market moves in the direction of their stop-loss levels and after triggering these stops, it resumes its normal trends. Let's consider that smart money aims to execute a large sell order.
As the price attempts to move upward towards the buy side liquidity, it breaks through the resistance level, triggering the stop- losses of retail traders who had opened short positions when the price reached the resistance. Simultaneously, it activates the buy stops of traders who execute buy orders as the price fails to respect the resistance level. Consequently, this series of actions generates a significant influx of buying orders in the market, presenting a great opportunity for smart money to execute their sell orders as they have artificially induced numerous buy orders into the market.
By initiating numerous sell orders, the smart money causes the price to enter the markdown phase and push downward. This scenario illustrates how smart money capitalizes on buyside liquidity and provides a brief explanation of its impact on price movement. Similar concepts can be applied to sellside liquidity.
Now let's proceed to the next topic and see how to identify sellside and buyside liquidity in terms of candlestick patterns and the various scenarios that we might encounter on the chart. We have fully discussed the equal highs and equal lows as the buy side and sell side liquidity. Now we are going to focus on the swing points as the potential buyside and sell side liquidity areas.
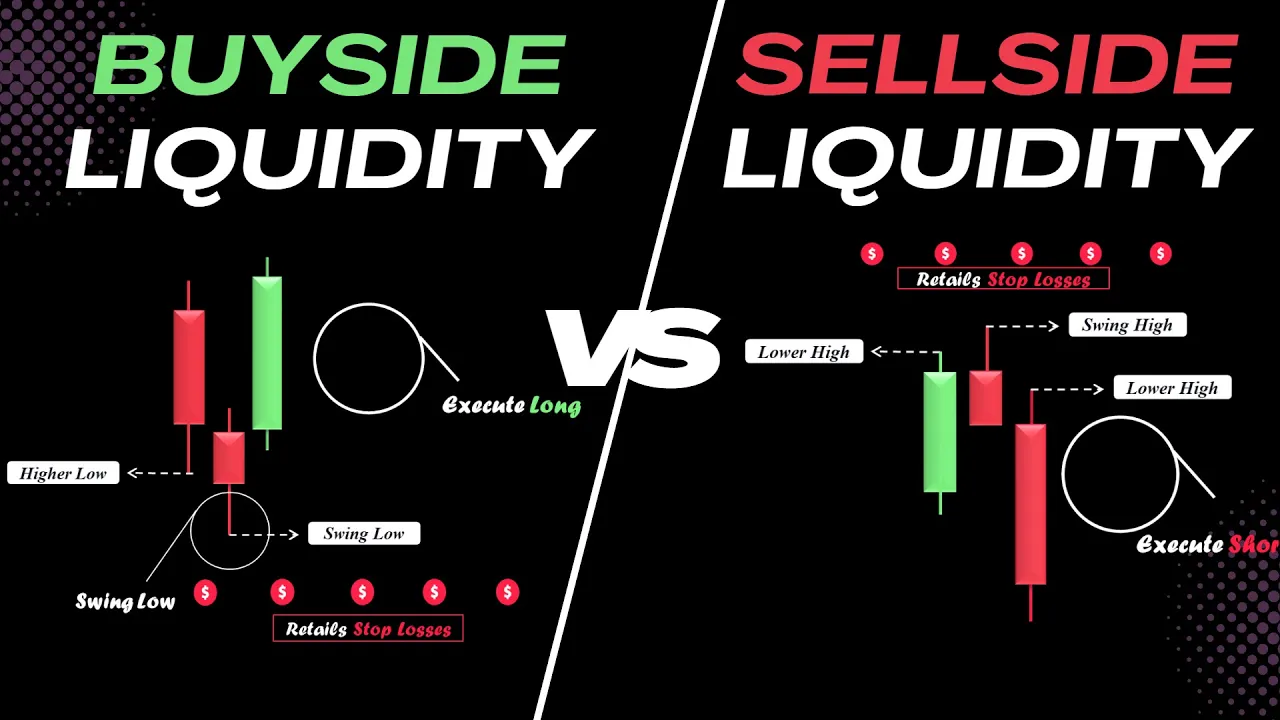
From the candlestick perspective, a candlestick swing low occurs within the three candle sequence and refers to the lowest low point situated between two higher low points in the adjacent candles. So here in this three candle sequence, we have a low point with a higher low to its immediate left and another higher low to its immediate right. That makes this point as the proper swing low.
Similarly, candlestick swing high occurs within the three candle sequence and represents the highest high point situated between two lower high points in the adjacent candles. So, what is the theory behind identifying these areas? If someone executes long positions in this area, they are likely to place their stop-loss at the recent swing low.
Similarly, if they open a short position from this area, they are likely to place their stop-loss at the recent swing high. With this understanding, we refer to the resting sell stop orders located below the swing low as the sellside liquidity. And similarly, we call the resting buy stop orders accumulated above the swing high as the buyside liquidity.
It's crucial to identify these zones in our market structure mapping because smart money is always looking to push the price below or above these areas to provide opportunities to activate their pending orders in the market. Understanding these dynamics can help traders anticipate potential price movements and make informed trading decisions. Now let's proceed to the real chart and see more examples.
Here we have Euro Dollar 4hour time frame on the screen. Now we are going to identify the swing points as the potential buyside and sell side liquidity areas on the chart. Let's start by identifying the most recent swing points within this bullish rally wave.
Can you point out where these swing points are located on the chart? We have a high at the extreme with a lower high on each side of it. So this high represents a swing high.
So we have the buy side liquidity just above the swing high. Similarly, we have a low point with a higher low to its immediate left and another higher low to its immediate right. This low represents a swing low.
So we have the sell side liquidity. If we look precisely, we can see that price already has created another swing point here as we have a low with a higher low to its left and another higher low to its right. So, we have another swing low which would be considered sellside liquidity.
In the following, we see that price takes out the most recent sellside liquidity. As the recent sellside liquidity is swept, it now moves to this swing low because here we have a low with a higher low on each side of it. Similarly, price swept the buyside liquidity above the swing high.
And now we have a high with a lower high on both sides of it. This represents another buyside liquidity over there. Let's move forward here.
Again, we have another swing low that has been swept by the price. A bit higher, we have another swing high that represents another the buyside liquidity near the previous one. The creation of buyside liquidity close to another buyside liquidity makes the old one more essential to consider.
Again, we see another liquidity sweep right here. As you can see, price has taken below the previous sellside liquidity and also creates another swing low with this long wick that we consider as another sellside liquidity resting below the low. Now, let's continue.
We see that price has entered into a great selling momentum and pushed to the downside and eventually swept the recent sellside liquidity. If we look closely here, we can detect another swing high right here. As you can see, we have a high with lower highs on its left and right sides.
So here we have another buy side liquidity that needs to be considered. In the following we see that price pushed lower and also swept the sellside liquidity resting over here. And also it is obvious that price forms another swing low which means we have a newly generated sellside liquidity beneath the recent swing low.
Now let's move forward here. Again we can detect another swing high as we have a high with a lower high on each side of it. So here we have the buy side liquidity resting above the swing high.
In the following, we see that price pushes to the downside to reach the sellside liquidity. As you can see, price swept the sellside liquidity with the wick of this white candle. Then price experienced a bullish pullback toward the buyside liquidity and also created another buyside liquidity with this swing high.
Now, let's continue. As you can see, price pushed to the downside and has taken out the sellside liquidity with this red momentum candle. That's it traders.
Thank you for watching this video. I hope you found it informative and useful. Don't forget to hit the subscribe button and turn on notifications to stay updated on our latest videos.
We value your feedback and suggestions, so please leave your comments below and let us know what topics you'd like us to cover in our future videos.