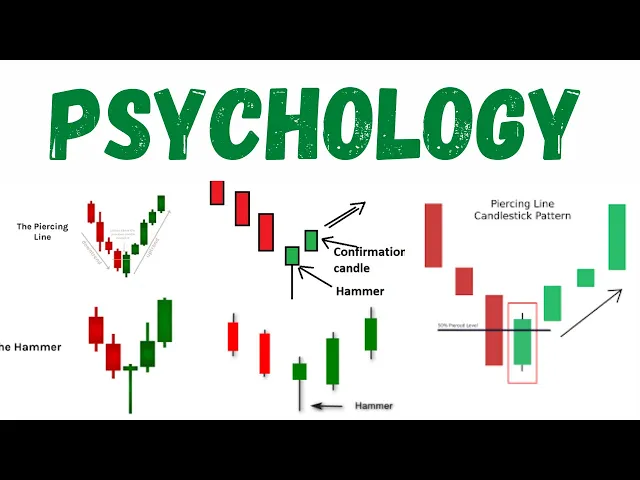
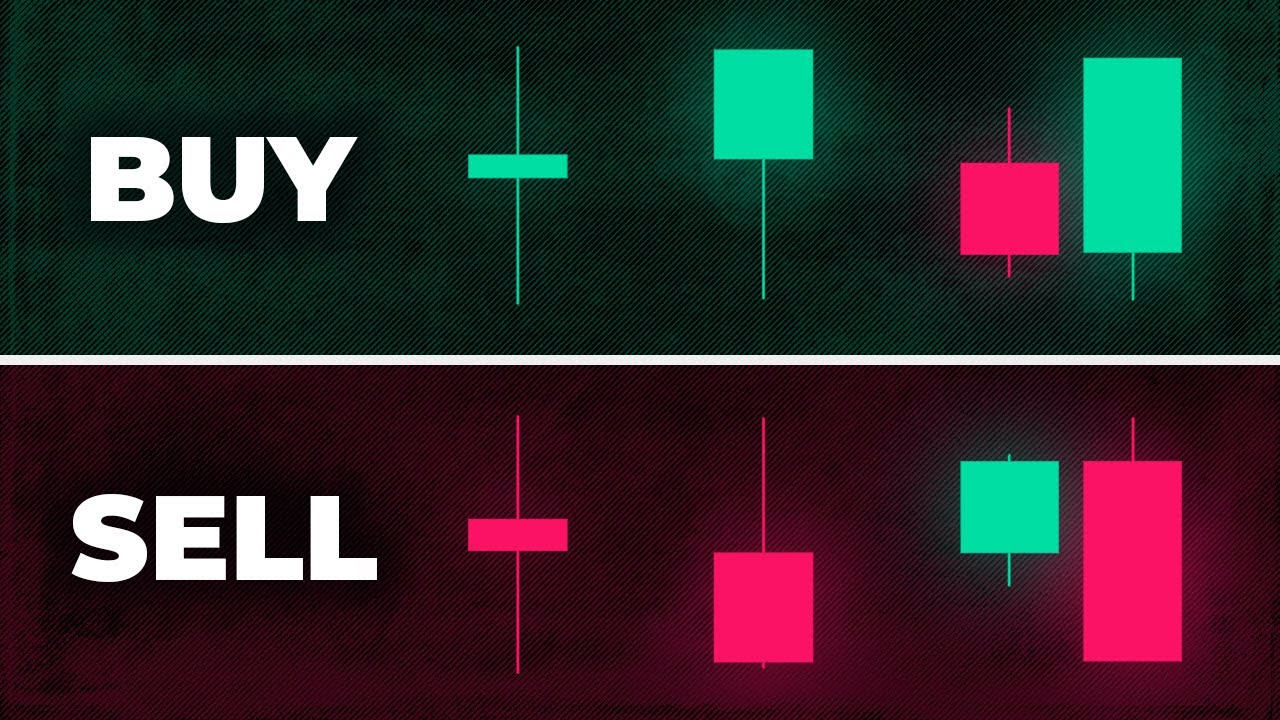
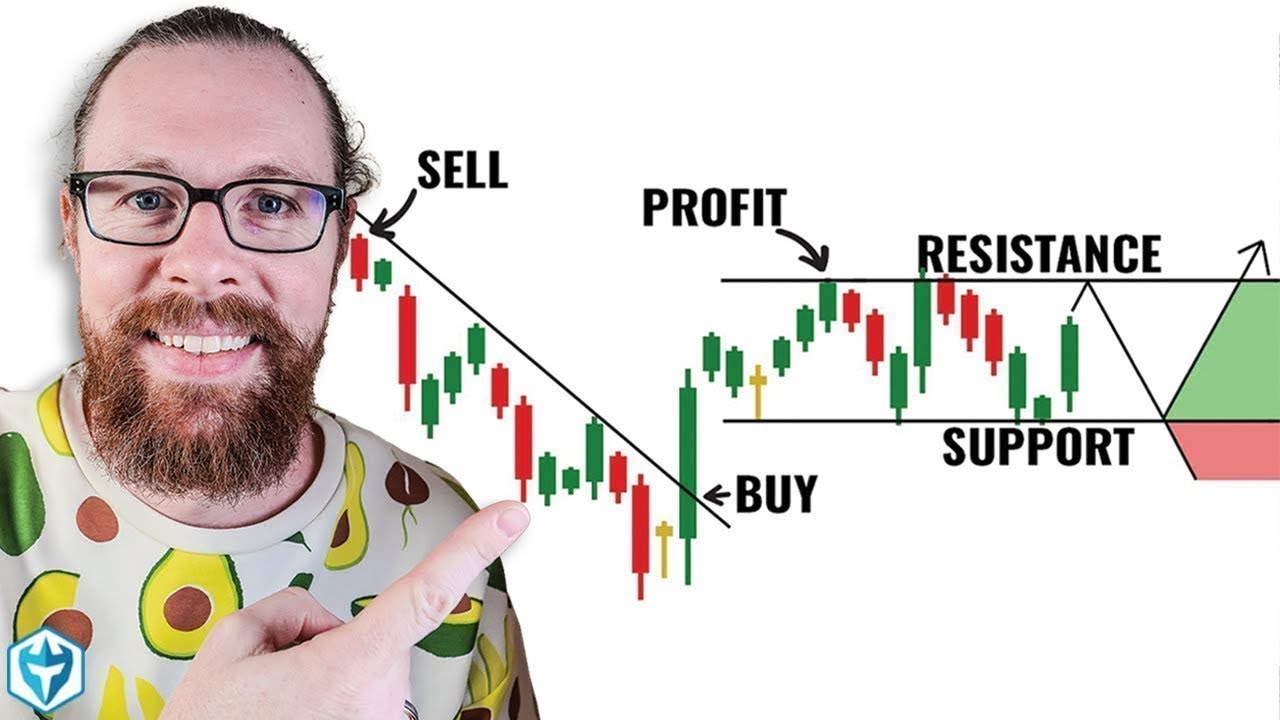
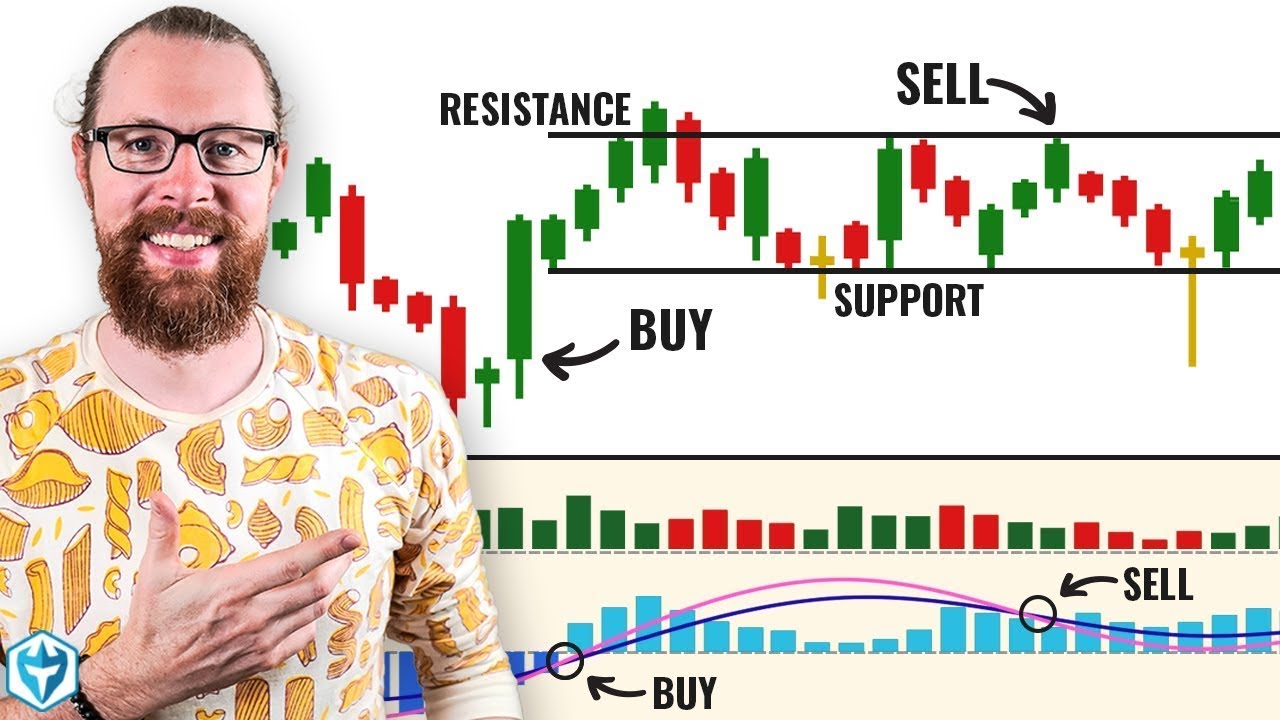
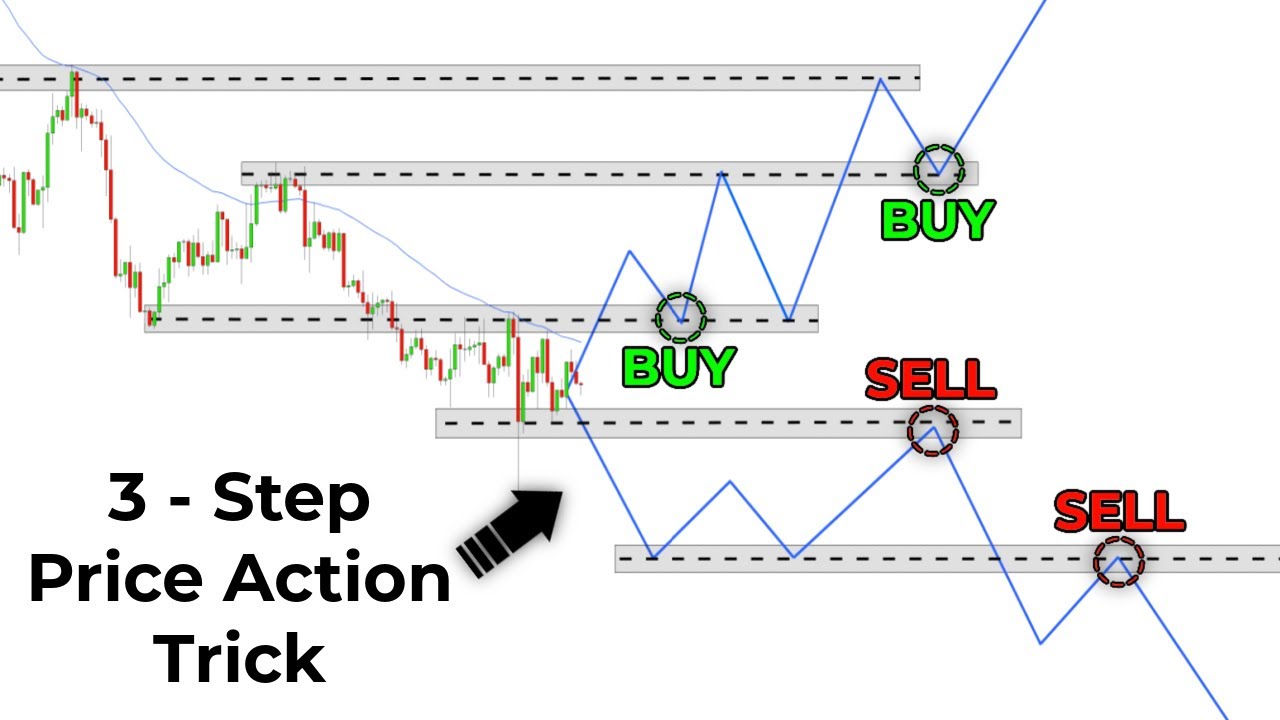
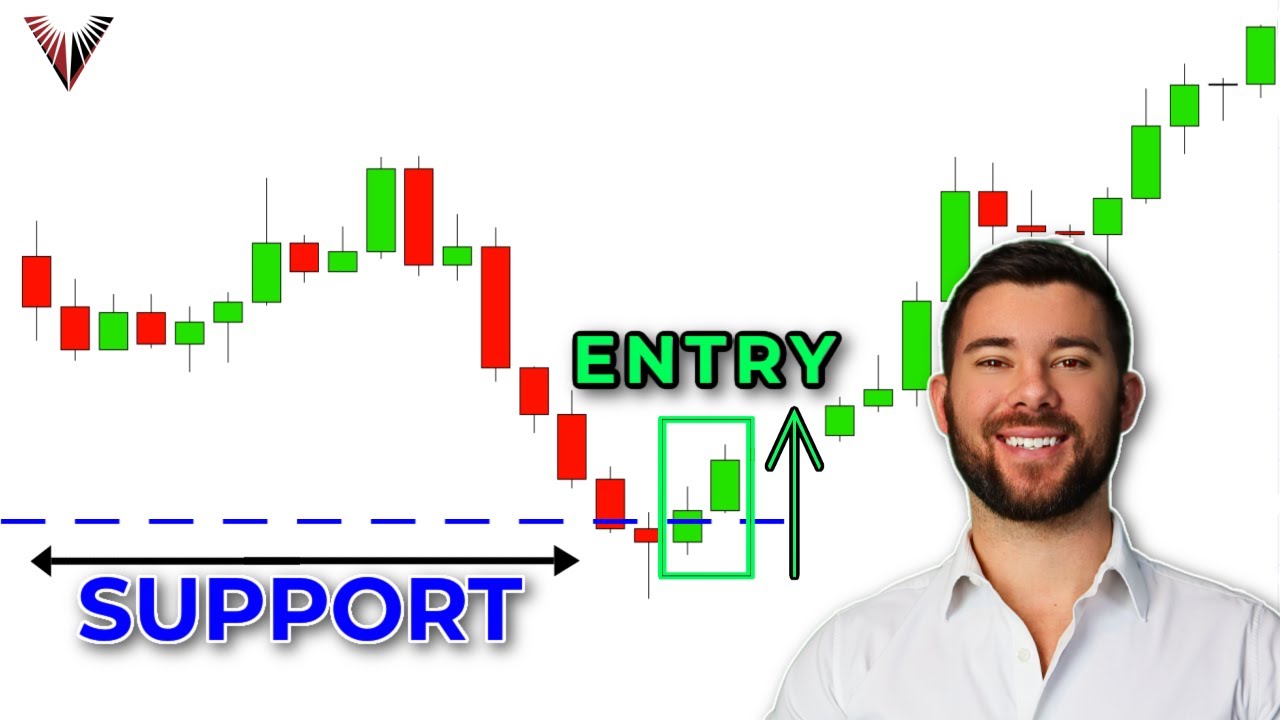
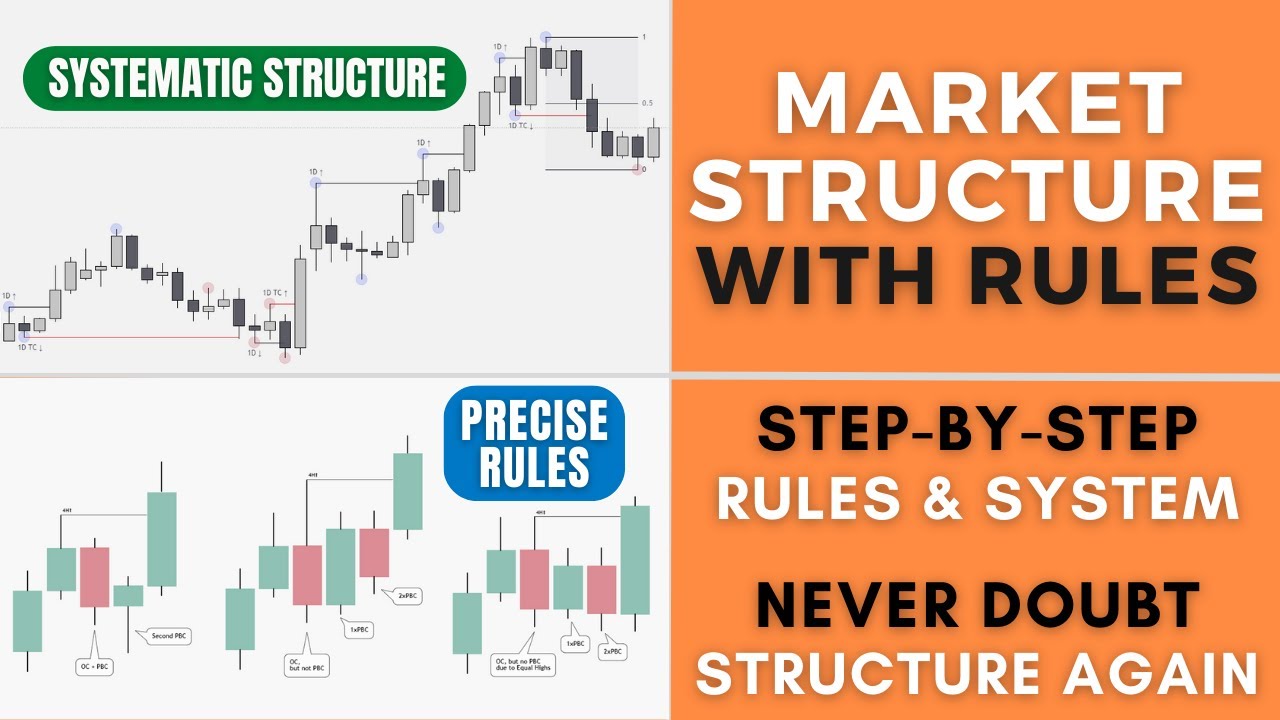
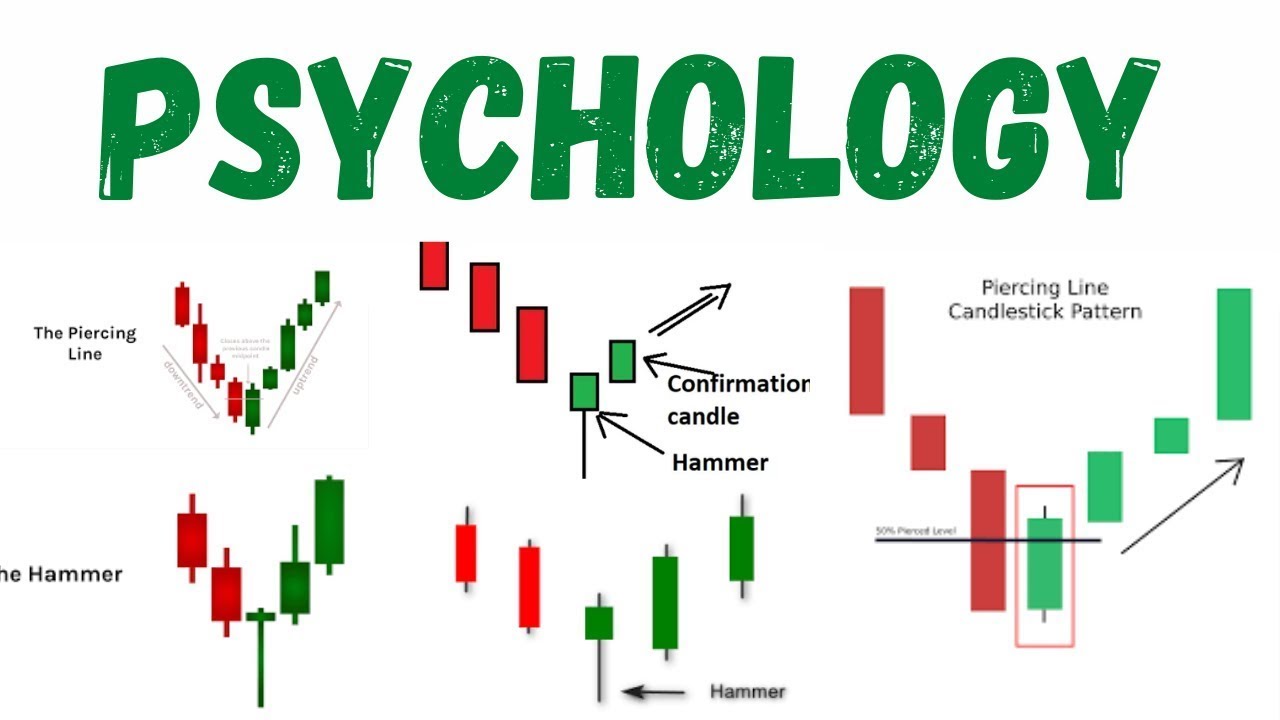
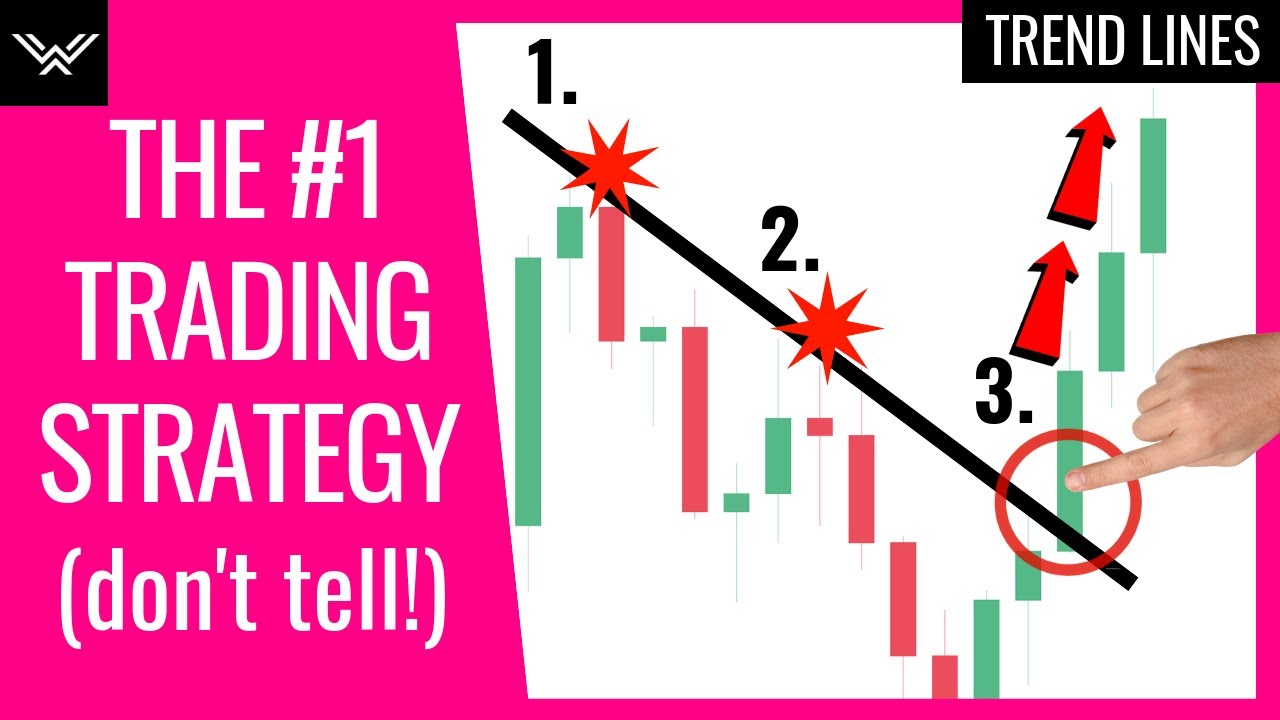
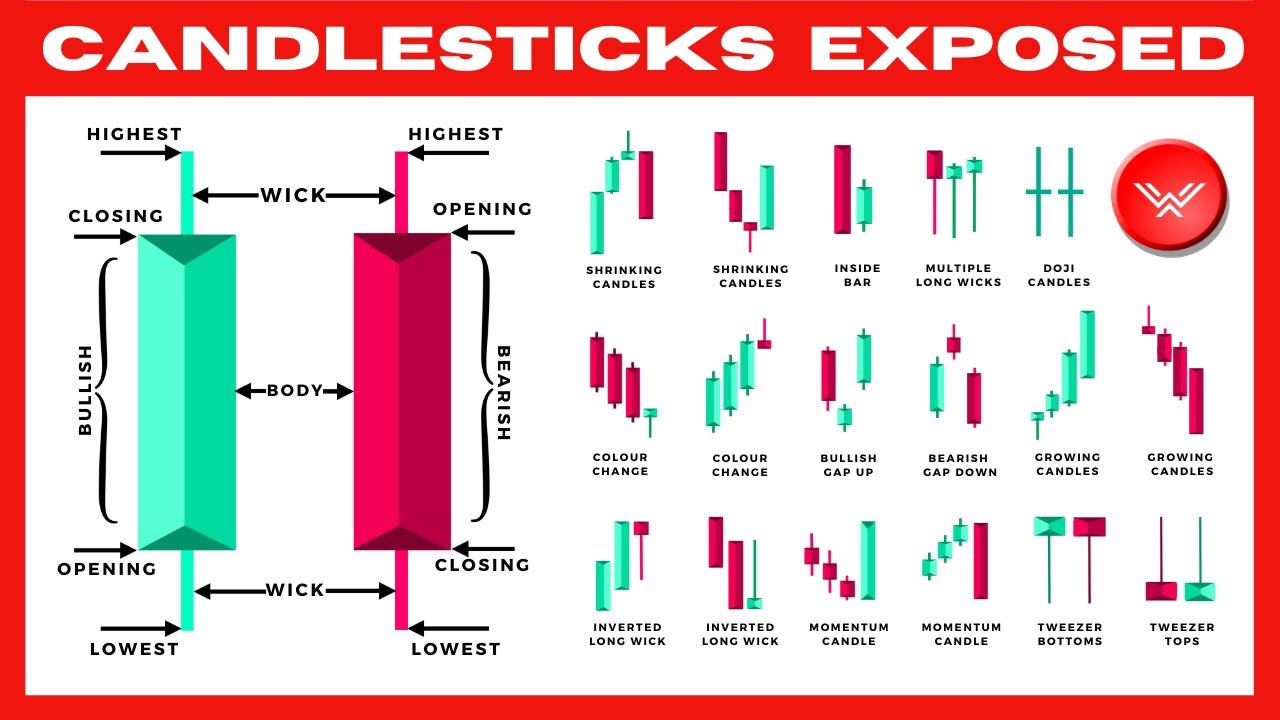
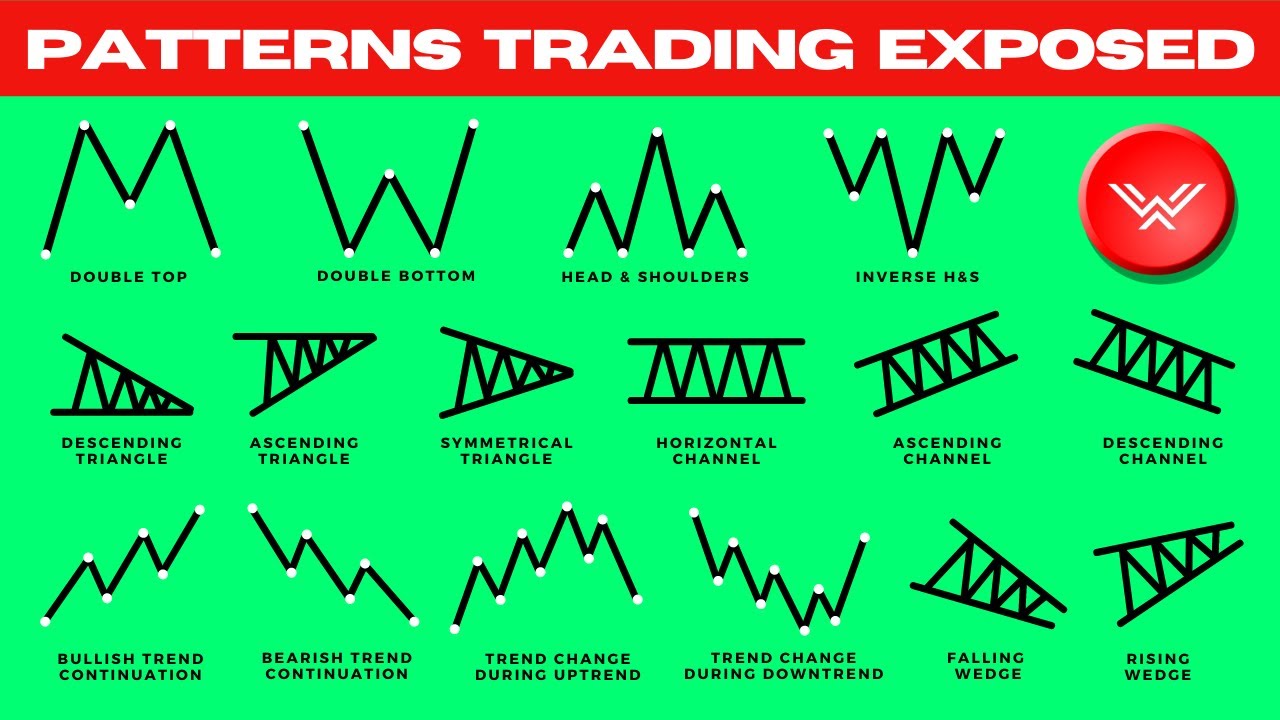
[Music] hello traders so welcome back to our youtube channel in this video we will going to analyze the chart we are not going to take trades according to our strategy we will just try to predict the next move of the market by analyzing the candlestick psychology and the support resistance levels so without wasting any time let's get started so as you can see we are on the chart and this is one minute candlestick i will going to use smaller amount like 10 dollars for each street and will try to take trade so as you can
see in this case if you look carefully what you will find you will find that market have resistance level here and a support level near here so this is the zone and this is also the zone market is getting and is showing constant rejection and the buyers are also showing constant rejection but who is more powerful by you think about it who who looks more powerful the buyers or the sellers according to the story for me the buyers are stronger and the reason is simple you can see the length of the week and the rejection
this is the strength of the buyers why because the length of the weeks are strong and the rejection from this level is actually massive if you look carefully here if you compare it from these rejections you will see that this the sellers are trying but the strength is missing or we can say that in comparison to buyers the sellers are weak so uh what we can predict here that the market wants to go in the upward direction because the chances are high that work the buyers will going to break through the recent resistance level and
that's why you can see that market is still trying to go up and up because these rejections from these sellers are strong the ba sorry these additions from the buyers are strong buyers are motivated in this case sellers are interested but the strength and the intensity is missing and you can say you can see that market is breaking this level now you can see this candlestick shows good strength from the buyers the sellers were trying but failed yes the market didn't break through the resistance level but still you can see if the sellers are strong
enough they could have moved the market in the downward direction but guess what happened okay you get the rejection but still the buyers are dominant here why because this is the territory of sellers and buyers are still dominating here because if this if the buyer if the sellers were strong enough they could have moved the market in the downward direction they are still trying but they are failing so this is the story now in in such cases what you should do you should always wait for the market to go in the upward direction give us
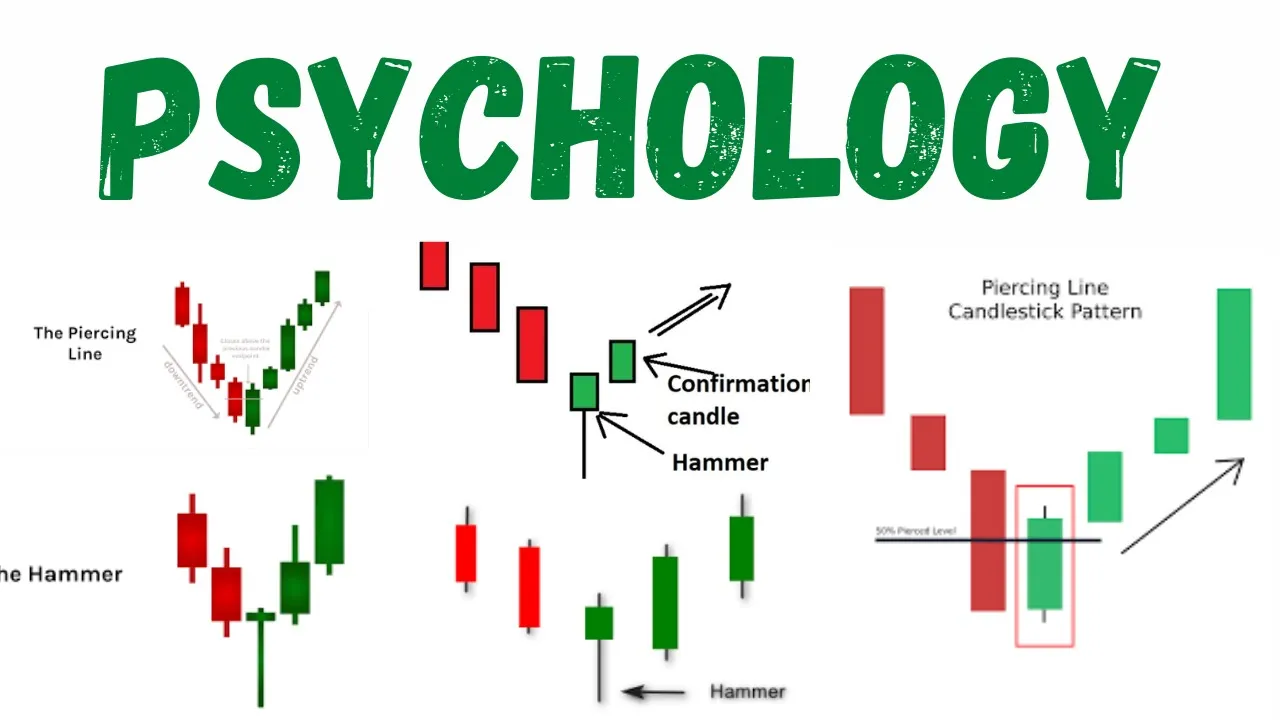
some breakout so that you can place your trade with the buyers as buyers are strong here now you can see this is a dosey now the dosi suggest one thing which is in decision in the market now if this doji was formed like here then we can say that both buyers and the sellers are strong okay or we can say that both buyers and the sellers possess equal strength but this dosey was formed at the resistance level it means that buyers are little are getting little bit weaker but sellers are still trying to like stop
the market it's not a reversal pattern it's a it's an in-decision pattern mark is trying to like understand which way which who is more powerful here but you can see buyers are still going upward and this is the clear sign why because for the last 10 minutes buyers are pushing the market upward and that's why it's going so let's take a trade here i'm not going with my strategy here so if i lose the trade don't judge me over it what i was suggesting what i was showing you explaining you was the story behind the
story was simple that buyers are strong enough and these wicks from the these rejection from the bias shows the strength and you can see that the market is going strongly in the upward direction uh so don't take this as if i'm winning this straight like this is a strategy this is not a strategy i'm just showing you these power of the story if you can construct a story from the candlestick the vix because they shows depletion the weakness in the market the momentum everything is in front of you the chart will help you to read
the psychology of the market you can see we have won this trade by without even uh like going with this support and the resistance or anything like that we just take the straight on the basis of candlestick that's all we did here now can we say that the sellers are strong here like on the current scenario can we say that the buyers are strong enough well for me the buyers are still in power but the market is reversing for the simple reason that this is a resistance level but is it very strong for me it's
not that strong it is a valid level because market was respecting this level for a in the in the past but this is not a strong level because if it was a strong level market should have reversed and should be going in the downward direction very strongly if the market is not moving strongly in the downward direction it means that this is a week now this is a strong confirmation from the seller side in such cases when market is heading towards uh support or the resistance level and it's very near you should always wait for
the confirmation because you never know when the buyers or the sellers will enter in this case the buyers were strong but the sellers entered and they formed a strong bearish confirmation right now what is the scenario can we say that the sellers are strong or can we say that the buyers are strong well it was a seller's area market form the bearish confirmation and market is continuing and is going in the downward direction showing that yes the sellers are strong here the buyers are losing its strength but guess what the upcoming area this is the
area where buyers have entered previously and market is reversing strongly in the downward direction again so the sellers are strong because the momentum is in the favor of these sellers but can we say can we take a place and uh place like put here no we can't buy because we don't have enough room and this is the buying zone here and when there is a buying zone you never know when the traders will enter so in such cases you have to wait for the confirmation the confirmation needs to be there i placed my trade on
this candlestick after this kind of say because i saw a great breakout the volume was in the support of the buyers and i couldn't see any near resistance level resistance level was here market goes till this level but in one minute we got our profit and was out of the market with some profit also so that's how it is so right now we have two zones the story behind is simple market pushed from this level till this level so buyers were interested here they pushed the market upward reached this level they booked some profit sellers
entered here why because this is a selling zone market goes down again they entered in the buying territory this is the buying zone again market you can see it is reversing strongly why because this is the buyer zone and buyers previously in the last 10 minutes were very strong and were dominating but in the last two or three minutes you can say the market reverses because the levels have been reached the resistance level has been touched and some of the traders might have or must have entered the short trade here so that's how now there
is a fight going in between the buyers and the sellers and if we go by the last like five or six scandal we can say that both the buyers and the sellers are strong only when the market is in their territory like the buyers are strong when the market is at the support level and the sellers are strong when the market is at the resistance level can we take a trade here well for me i don't think that we have to take a trade in between the fights what you have to do is to wait
for a proper breakout and if you get a breakout you can say that one of the traders have won the trade and we can go with them so whosoever looks powerful you always try to apply your strategy in such a way that you go with the powerful traders like the most of the traders like if there is a breakout in the upward direction the resistance has been broken then we can say that the buyers are strong and we should place our trade in the upward direction why because as the buyers are strong they are going
to take the market in the upward direction so that's how it is and if there is a breakout in the downward direction you can say that the sellers are strong and you should also go with the sellers in that case so this is the story now as you can see market is forming a spinning top we can say it's a spinning top or some someone can say it's a dosy it doesn't matter because both shows the industry now it is forming in between the territory of buyers and the sellers this is the buying territory this
is the selling territory this is the candlestick pattern which formed in bitbeam now the buyers are pushing the market the seller were pushing the market also it formed in bitbeam showing one thing only that both buyers and sellers are interested right now and they are fighting vigorously and market is indecisive in between the market like in between the levels market is indecisive which way it wants to go because both buyers and the sellers are trying their best it's better not to fight in between just wait patiently until the clouds clear so in such case now
let let me draw one more level here so you can see now this is the next or you can say this is the nearest resistance level so we can say that the sellers were there previously but now where are the sellers the sellers are here okay some internet problem no worries we are explaining things so it doesn't we actually didn't require that fast connection but still okay so this is we can say that now shallows have shifted and are here now i need to change the time frame actually so now uh when you find out
that the levels are shifting like sellers were here now they are here you need to look for the bigger trend the bigger trend is downtrend and that's why sellers needs to be in more strength and in majority of their will be majority of traders who will be uh who are going to be a seller okay what is the problem so this uh so we can say that yes we have to wait ins that uh we have to wait uh that we get a breakout in the downward direction why because you can't trade in bit bean
there is no enough room for this but wait for the breakout what is going on there is some problem with the wi-fi no worries okay it's fixed now so as you can see as i told you that now the shallows have shifted we have to wait for the breakout in the downward direction and the same thing is happening why because buyers tried their best but as the major trend is downtrend market is going to continue its trend after some retracement and the shadows are going aggressive here and i will include this vic also so this
is the last place where the buyers were present for me now if we get a break out in the downward direction where you think the market is going to go for me the market will go in the downward direction but still you can see the rejection it shows that some of the buyers are still interested and if we if you didn't get proper breakout it means that there is some hope left in the buyers and you should not enter your trade here because at any moment there could be majority of buyers who will enter and
will make the market move in the upward direction and same goes here market is reversing that it's not that hard but i will not say that it's easy you have to practice you have to understand why it's happening the levels are important the vic the rejection shows everything in front of you it is all in front of you you don't need indicators you don't need a perfect strategy you just need to be right like 60 of the time to make money in the market but you have to be very focused when you are taking trades
the mindset needs to be very clear that what you want to do just read every candlestick read chart as much as possible self study will help you more in this field and buying courses from here and there will not going to help you switching your strategy every week is not going to help you just stick with one strategy and try to master it when i started i was like you guys most of you guys i was switching from one indicator to another but sooner or later i realized that the indicator is not going to help
and i have to stick with the price section the candlestick and after that i started like i stopped trading on the real account for like one years and just focused on practicing the chart patterns and the candlestick and analysis like support and the resistance everything about like technical analysis that the basic things are very important in this field and like the guy who uh those guys who on youtube who sold you like stuffs like indicator award like aggressive strategies like so many things they are not actually the working thing in the trading industry you have
to stick with the basics and the basics will give you all the answers that you need because at the end of the day these are oldest gold as we can say so price action is the key now you can say that market is going downward why because this is a downtrend and the sellers are pushing the buyers are trying you can see the buyers are still trying but can we say that the buyers are strong enough no why first of all the trend is downtrend second of all this is a buying zone and market is
still moving here it means that buyers are losing their power and as soon as we got the majority of sellers this is going to be a breakout there is going to be a breakout and the market will go in the downward direction again now if you go by previous story market tried going up it is trying going down but again you can see market is actually trying really hard here the the volume is there but still some of the buyers are still managing this level what we need here is a proper breakout once there is
a proper breakout the market is going to hit the next support level let's zoom out to find out if we have any no we don't have any on the one minute chart obviously but on the bigger time frame we we should be having some levels here or there so this is the this is the story behind the sellers are aggressive and they are strongly trying but we need to find proper breakout and that's all we need here right now as you can see sellers are trying but buyers are still managing to hold this level but
the strength of the bias is less and we can't take a call trade here we can't place a like a buy call here why because simply the buyers are not that strong here the candlestick shows the bearish confirmation market is at the support level and is still trying to break it rather than reversing from the level showing one thing only that the sellers are strong and the buyers are weak now this might be the case that when there is will be a breakout now two thing happen when there is a breakout one that sometimes the
market retraces back and sometimes it continue to go in the downward direction or the upward direction or we can say generally in the direction of the breakout now let's see how this candle finishes and if this candle finishes with a strong okay this is so i have taken a trade here i didn't apply my strategy here i'm just using the story so don't judge me as i'm saying it again now why i took this straight the sellers tried breaking it reverses again it goes down it reverses again trying like it it was like the uh
what how can i explain it in as is language as possible so understand one thing they are they were trying really hard and the buyers are for holding it but there is limit to everything the limit has been broken and that's why the sellers break through easily and this was a strong bearish confirmation from the selling site and that's why market is below the level it is going in the upward direction but the sellers are strong here the buyers are trying but it doesn't matter actually we lost this but our analysis was correct because market
is holding on to this and market in the future will go in the downward direction we didn't apply our strategy it was just the story which we are playing on now this is a spinning top or we can say a dose it's an indecision in the market now let's let me go on bigger time frame to find out if we have any support level okay so as you can see here i will remove all previous levels now when you apply your strategy you will look on every level every possible level that you have so this
is the zone now this is a support zone here okay now let's go on one minute so as you can see market is heading towards this zone this is a support zone meaning it's a buying territory market goes strongly down it formed a dosey or a spinning top showing in decision in the market it shows the indecision when market was above this level it doesn't show the indecision when it was at the level there is a difference it shows uh initially in the market it means that buyers are actually waiting for this level because without
even touching this level by shows their interest they stop this level now market is going strongly in the downward direction now the main thing which matter here is that if the buyers are buyers will outnumber the sellers the level the market will going to reverse otherwise it will not this is the this is a mere confirmation that yes there might be buyers waiting here but the volume and the momentum of the market will decide if the market is going to reverse or not in this case you can see market goes strongly again down the buyers
rejecting it bias rejecting it and they are still trying but i didn't see any bullish confirmation here it means that the buyers are not that strong in this case so that's how it all goes but our prediction was about this trade about this setup and about this setup was clear that market will go will go continue to go at a particular direction you can see we saw a breakout with this scandal now market is going down it is going to hit the next level and it is hitting right now it is at the support level
now what can i do in such case can we take a trade for the call here can we take a put well of course not you cannot take a put here for the simple reason that it is a buying zone you can't go against the level but you can't place a call here why because you didn't have enough evidences that suppose that market will go in the upward direction well in in such cases you have to wait for a confirmation now this is a good level market shows some buyers some buyers in this season again
but i didn't see the strength the momentum that we need and the momentum that market needs to reverse so in such case you have to wait patiently because market is going to give you infinite opportunities so you have to wait until you got some good confirmations right now as you can see market is trying to go up but is it very strong for me it's weak it is trying you can see now the the wick here this is the sellers market is trying but it is getting constant rejection from the seller side there is no
strong confirmation from the buyers and as this is a support level no strong confirmation from the sellers sellers are still dominating here because it is a buying zone and still market is moving at on this level so as you can see market is breaking this level again and the simple reason is that because the major trend is downtrend and that's why the sellers are outnumbering the buyers again and again and that's how a trend is formed so i hope that whatever i can explain about this chart i did and if you have any doubt you
can ask me in the comment section if you want me to make videos like this just let me know in the comment section also if you like these videos make sure you share it with your friends because this is the most important thing that you need when you are training in the real world so that's it for today i will try to make more videos in the future that will going to help you with your technical analysis journey till then keep training keep working hard good day