in this video we will describe the three indicators used in performance analytics as well as how to create them in performance analytics indicators are metrics or measurements that measure specific parameters of your operations such as Services activities and behavioral performance these indicators show where these parameters stand at any given moment and over time they show Trends to help you see where you're doing well and where you can improve to create an IND IND Ator you need one of three roles PA power user PA admin or admin you'll also need a paid for performance analytics entitlement
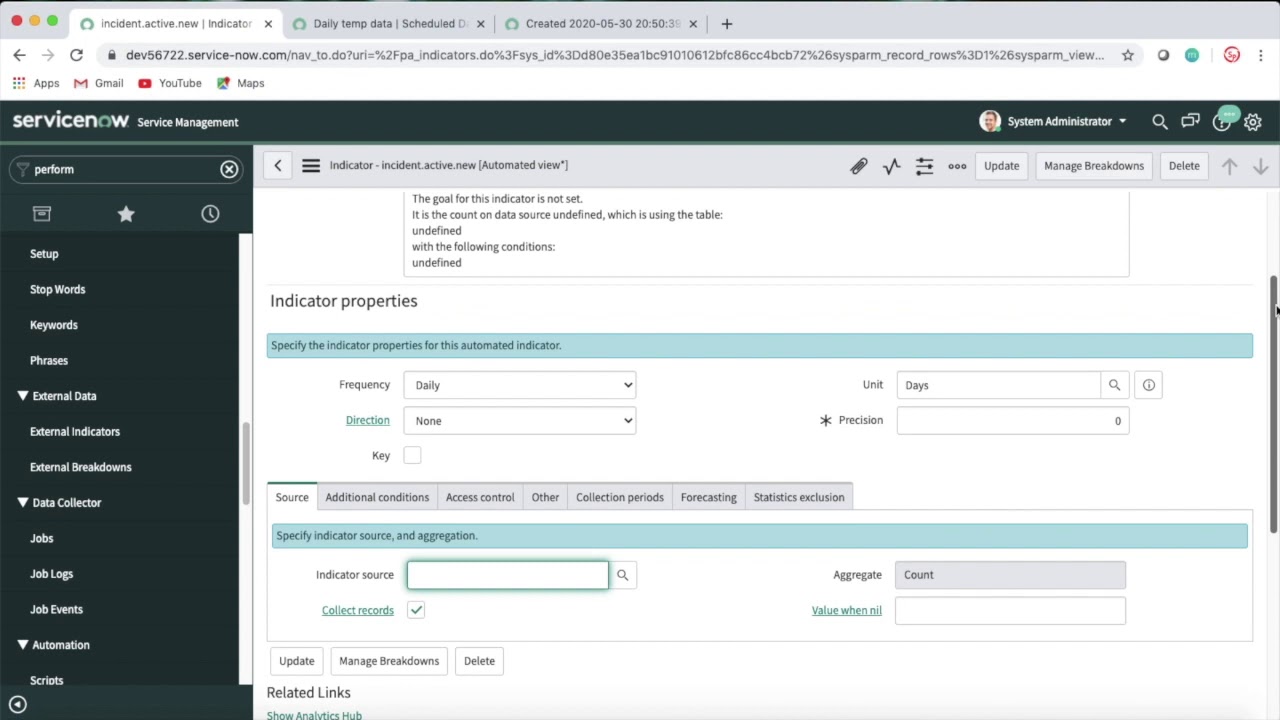
what types of indicators can you use performance analytics provides automated manual and formula indicators automated indicators give you scores directly from the service now database tables for example number of new incidents pulls data from the incident table when we look at its properties we see that data is being pulled every day in the frequency column and the system is pulling Source data from the incidents. new indicator source to populate this indicator the method of aggregation is Count meaning the scor is a simple count of the new incident records rather than a calculation manual indicators let
you enter scores manually you might do this when the The Source data is restricted access or resides outside your service now instance when we create a manual indicator we can make it appear in scorecards by selecting the publish on analytics Hub checkbox and we can control access to the indicator by making it visible to all roles or only certain ones finally we can specify the people who are allowed to enter scores for the indicator these people will need the PA contributor role the last type of indicator formula let lets us calculate the score and performance
data from the scores of automated and manual indicators for example the formula for the incident backlog growth indicator is the number of new incidents minus the number of resolved incidents here's our scenario our HR department wants to know what percentage of their new cases are opened by people visiting their office in person each day we'll start with creating a manual indicator for the number of new cases that were opened in person in our example an HR Manager will enter that number manually every day and the indicator will keep a running count this unit is a
simple count the user who creates manual indicators must have the PA admin or PA power user roles because HR data is sensitive we don't want this indicator to appear in analytics hubs so we clear the publish on analytics hubs checkbox to specify Ro visibility select visible to everyone this enables you to select a ro role you can specify individual user and group visibility but we want to specify that only users with the admin role can see the values for this indicator finally we specify our HR manager Linda as the contributor we need to give her
the PA contributor role so that she can enter scores for the indicator back C in the manual indicator the scores for this indicator link takes us to the score sheet where we can enter scores for the past week starting on November 21st including today these values are saved as soon as we enter them next we'll create an automated indicator automated indicators are the most frequently used type of indicator they're used to calculate scores on a set of records from a table that stores information about a business process the HR department uses the service now HR
solution which tracks all HR cases that means we can create an automated indicator for the total number of new cases because we have a data source to pull from we can specify the source here on the source tab often we can find the indicator's source by searching but this time it doesn't exist so we'll add a new one and call it HR cases new we're tracking our new cases daily so we select daily for valid for frequency then we select the fax table the fax table is the table whose records you want to evaluate in
your indicator in our example it's the HR case table then we'll apply a condition for the HR case an indicator Source must have at least one condition to filter the records on the fax table we've created an automated indicator for the total number of new cases since November 21st and a manual indicator for the total number of new cases that were opened in person since the 21st now we can use those two indicators to calculate the percentage of new cases that were opened in person to do that we'll create a new formula indicator and call
it percent of HR cases opened in person we're calculating a percentage so we'll select percent for the unit we'll build our formula in the formula field the percentage is the number of HR cases opened in person divided by the number of new HR cases and submit that's it we created an automated indicator a manual indicator and a formula indicator based on the first two now HR knows the percentage of new cases opened in person each day for more information see our product documentation or knowledge base or ask a question in the service now community