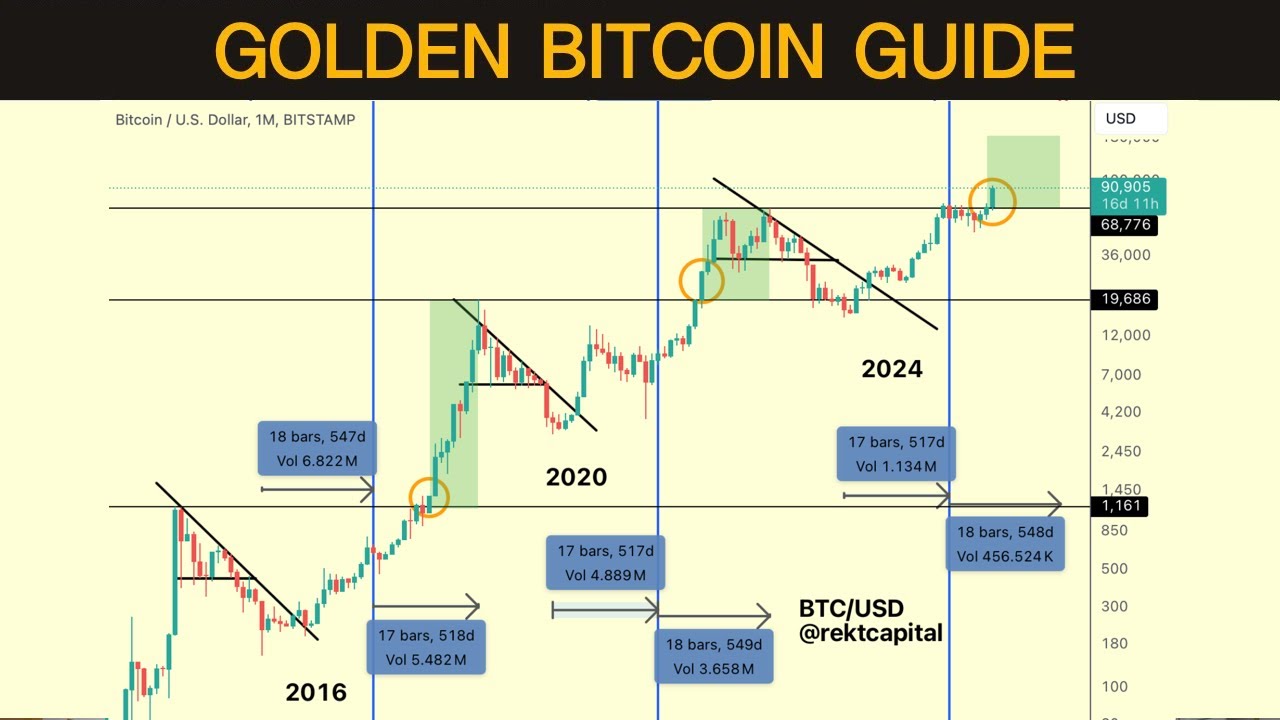
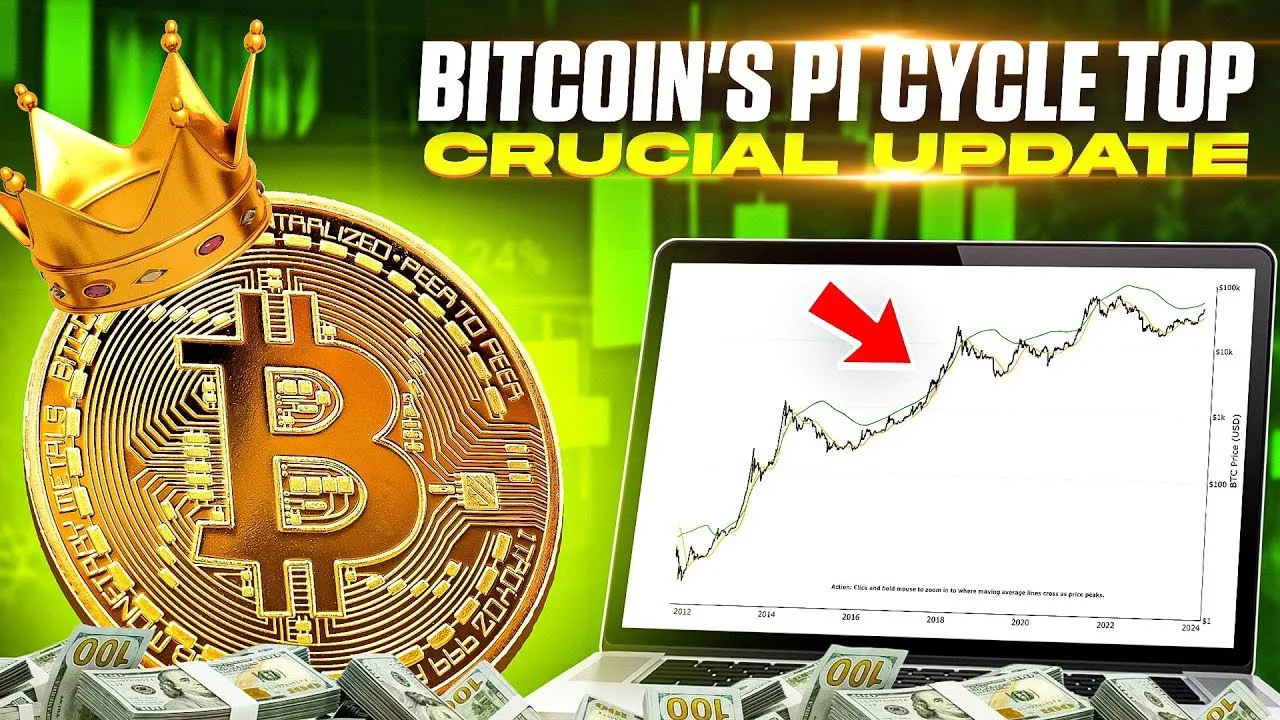
in today's video we're going to focus on the P Cycle top indicator because it's one of the most accurate indicators in denoting and establishing a bull market peak in the future this comes through the guise of a bearish crossover in time when these two key moving averages cross over that's a bearish crossover and it has pinpointed quite accurately in the past when we've seen a bull market Peak so we'll be talking about when could we see a bull market Peak based on these potential Crossovers and we'll be doing that through extrapolation data so subscribe to
the for more videos like this in the future like this video if you enjoy content like this going forward and let's dive right into it so the Haring years 2016 for example we tend to see Bitcoin hold the orange level this orange moving average as support all the way to the bull market top and this has been the case after a Haring year so 2020 is also a good example of that because whenever we see holding of support here we rally to new alltime highs andb and any downside deviation below this orange moving average that
tends to represent a bargain buying opportunity so when we look at 2024 another Haring year you can notice here that we saw a lot of downside deviation below the orange moving average and that was indeed a bargain buying opportunity as you've been tuning into the videos over the past few months we were talking about this bargain buying opportunity and then inevitably as history has shown us many times before this moving average then turns into a new support and then we rally simply higher but what's really curious about the next moving average that we talk about
this green moving average is that it tends to act as a point of rejection until it doesn't so we tend to see rejection before we finally see support at this green moving average and the same thing has been the case in previous Cycles even the more earlier ones where we rejected from this green moving average and then overextended beyond it dipped below it briefly and then overextended beyond it once again and so here you can even see in the 2021 cycle we rejected from this green moving average before overextending below it and ultimately when we
lose as support that tends to be a really good initial trigger that the Bulls side momentum is slowly waning and so you know these fake breakdowns here that was a bit of an anomaly in that regard this mid cycle has never really repeated itself so that sort of overextension towards the upside that's a bit of a fake Break down and similar thing here as well we see a fake breakdown before we rally to new alltime highs in 69k versus 65k right over here so the main point is that we tend to see rejection from this
green moving average in the initial stages but then price overextends Beyond it quite substantially and that's been the case in all bull markets and you can notice that the first time of asking in this cycle we rejected from this green moving average as well and so in the future once we revisit it we could reject from it once again but it's going to be a shallower retrace compared to what we saw here because you can notice that in the past on the first time of asking there is a bit of a struggle to break this
green moving average and this can happen even on a few occasions as 2017 has shown us but generally speaking it's that one to two times that we try to break Beyond this green moving average and then we finally manag to do that so at some point in the cycle yes maybe we get a bit of a shallower retrace from here and a rejection from here but we overextend beyond that point and the green moving average actually represents the price point of very close to $120,000 it's $119,000 right now so in the future we're probably going
to revisit this level maybe reject from it and into a bit of a small retrace a a measurable a a normal retrace nothing too crazy I don't think because we saw a 33% pullback from this recent rejection from the green moving average so we'll revisit this level at some point in the future reject into a shallow retrace and then overextend beyond it in the future so those are those two moving averages but let's talk about the bearish crossover in a bit more detail because we know from this chart that when we see these two moving
averages converge to such a extent and point when they converge to the point that they cross over we tend to see bull market tops occur and this has been quite a good indicator in the past when it comes to getting really close to pinpointing that bard Market top and doing so quite successfully at 65k we got to 69k but that was still a relatively good moment to to cross over and tell us that this is a bull market peaking Zone same thing here as well and this midcycle this was a good example to just dollar
cross average out during this P Cycle Crossover at a midcycle point so we had this sort of fake fake out here because we got these signals twice right over here but the pice cycle moving average crossover indicator didn't actually exist during this time so it's interesting how it only started to exist in recent years and when it mattered most this was a live indicator and probably one of the most single accurate data science indicators that gave us really a a 5day window of precision that this was a P Cycle crossover and that bull market Peak
was looming large so in the future of course A P Cycle crossover shouldn't be the only indicator that you look at when when it comes to a bull market peak in the future but in terms of a bearish crossover it's going to be a really important indicator nonetheless not to ignore and so we need to look at both of these moving averages and try and extrapolate them because that's going to give us a better idea as to where we could see a bearish crossover in the future and of course this moving average is going to
be a little more sensitive to changes in price action than this one this one takes into account more days it's 3 50 days multiplied by two whereas this is 111 days and that's simply a more sensitive price sensitive moving average to changes in price price action so this is going to change quite a bit and so if we extrapolate this then we could see a bearish crossover in December late December 2025 and this just goes to show that we still have so much more upside left to enjoy we're definitely going to see this moving average
uh tilt towards the upside and curl up towards the upside which would mean that this would actually shorten and bring this dat a little bit closer and in fact if you focus on this line here it doesn't necessarily take into account that initial curl or at least that most recent curl that we're seeing in the green moving average so if we take that curl up into account then that actually pushes the bearish crossover by two months or a month and a half into February 2026 and we know from the fouryear cycles that this isn't going
to be a realistic bearish crossover event because by this point we're going to be already in the very initial stages of a brand new year long minimum year long bare market so I don't think this is going to be an a bearish crossover in February 20126 I think it's going to happen even earlier than December and this is a function of how much price starts to continue rallying higher and as long as it continues to Rally higher which it probably will it's going to to be tilting this moving average even more so so that's going
to change these trend lines quite substantially meaning that we could be seeing this signpost move a little bit closer to us but at the same time we're going to see pullbacks in price Discovery as well which is also going to make these moving averages tilt down and so it's going to be a moving Target essentially when we rally in price Discovery and see fantastic gains then this bearish crossover propagated via these trend lines that's going to bring that crossover date closer and closer and closer but then when we see price Discovery Corrections it's going to
push and Kick the Can so to speak down the road progressively and progressively so we're essentially going to be seeing price Discovery uptrends seeing these crossovers get closer and closer and then we see price Discovery Corrections and then uptrends again and then Corrections and at some point we're going to hold in on that date as price gets closer to that date and these moving averages converge and get closer to each other as well so essentially we still have so much more to enjoy in this bull market the bearish crossover is nowhere near close to crossing
over so we still have a lot yet to enjoy and and if this is 118 119 120,000 and we still have yet to overextend Beyond here then I would probably only start looking once we've overextended Beyond here and I'd start looking how do these two moving averages measure up to one another how how close are they getting because price only tends to tends to spend not too much time beyond that green moving average it's only a fraction of the market cycle if you really think about it here as well this this time beyond the green
moving average is even shorter and even more shorter right over here before we lose that level and move sideways so we're not going to spend too much time beyond that green moving average and so once we finally break beyond that green moving average then the clock is going to be ticking in terms of how much time is it going to spend Beyond this green moving average and it's going to be a function of how close this green moving average and this orange moving average is how how close are they in that moment in time and
that's going to help us narrow down the possibilities via propagating these moving averages into the future looking at how long is price Beyond this green moving average how much time are we in in terms of the cycles and how much parabolic upside phase is left and how does that tie in with price Discovery ways of which we've been talking about in previous videos but that's about it for the Crossovers thanks so much for tuning in subscribe to the channel for more videos like this in the future like this video if you enjoy content like this
going forward and would like to see more videos like this in the future armor capital and I'll speak to you in the next one speak to you soon