Hello everyone, Paul from Cryptoormation with you. Today, I'm out of the office traveling in Europe for a few more weeks. Today, we're going to make a video that I recommend you take notes or watch a second time to understand because I think it can help you for the next bull cycle or to navigate no matter what market you're going to be in.
So today, we're going to talk about market cycles and more specifically the cryptocurrency market cycle. What can we expect? Because we know that roughly every 3 to 6 to 9 months, the same cycles repeat themselves in the crypto markets, it's different timing.
So by understanding this, it's possible to make more gains in the cryptocurrency market. And I'm going to show you several special charts, including a chart that goes back 150 years and is still relevant today, and I'm going to show you my special chart that I created for the cryptocurrency market. So I think this video will be of great value to you.
So the only thing I ask in return is that you like the video. Have you done so? If you haven't, please do.
And before we start the video, once again, remember that I am not a financial advisor. So everything I say in the video is just my opinion. So that being said, let's get started with the video.
So before we talk about the cryptocurrency market cycle, let's talk about cycles. As you know, there are several types of cycles. There's the adoption cycle that I showed you in my last video, which I recommend you watch right here if you haven't seen it.
And we can see that it's always the same thing. We have the innovators who arrive at the beginning, the early adopters, the early majority, the late majority. And that always creates what we see here, the S-curve, which is the gray curve.
And that's an adoption cycle no matter the technology. We can see it right here. You see, each technology has been adopted by an S-curve.
At the beginning, we have the first ones who leave, then the majority starts to catch on, and then we have the laggards at the end. You see, this was the case with the telephone, which was one of the technologies that took the longest to be adopted. And now, you see, the more we advance in time, the faster technologies are adopted, like we see television, credit cards.
And here, the chart stops in 2010. If we were in 2020, we would see everything from social media to artificial intelligence to cryptocurrencies. The adoption of all of that is increasingly parabolic.
So all this to understand that these are cycles that repeat themselves whether we like it or not. It's the same with the moon, the days, the nights, the months. It repeats itself year after year after year.
When you make a training plan to train for Iron Man, for example, there are cycles to follow, microcycles, mesocycles, macrocycles. And if you don't follow the cycles of volume in relation to intensity, in relation to rest, you're going to get beat up and you're going to be tired or you're not going to be ready for your competition. We have the cycles of the seasons that repeat themselves, you understand?
No matter the subjects, the characteristics of life, there are cycles and we'd better respect them because, if we don't respect them, for example, we arrive in winter or is there snow here and I decide to wear a t-shirt and shorts: but I'm going to be cold. And it's the same thing we see in the markets. We must respect the cycles and adapt according to the season of the cycle we are in.
And here, you will really be interested in what happens next. So for the market, I think you are familiar with this Wall Street Cheat Sheet chart . It is the same thing that is repeated cycle after cycle after cycle on the markets.
Why? Because the markets are made up of humans. And what do humans have in common?
Well, they have a brain , a psychology and crowd psychology. Human psychology is always the same and it always creates the same cycles in the market with some variations depending on the assets, depending on the liquidity, and it is easy to sell or buy, it doesn't matter. But it creates this kind of cycle that we see where when an asset goes up in price, a cryptocurrency, a stock, everyone gets excited, starts taking out debt to buy more.
When we were at the top of the market and at the bottom of the market, people didn't care at all, they weren't interested at all. So, it's time to buy and the biggest players, the biggest whales, the biggest entities that make money, who have a different playbook than ours have understood this for years and they make money by understanding the cycles. So this video will show you some interesting cycles.
So first, study the Wall Street Cheat Sheet. If you haven't understood this sheet, take the time to understand it. The first thing I'm going to give you to study is if we continue with the cycles.
Today, I'm going to show you a few pages from my monthly report for September 2023, which is 66 pages long, because I think it's worth it for you warriors to really understand what's happening in the markets. And here we see another cycle chart. We always reach points where there is maximum risk, as we can see here, and a point where there is maximum opportunity.
And in my opinion, in the market, there is a point where there is extreme fear and where there is maximum opportunity. And in the cryptocurrency market, it doesn't happen often. And I would have liked the cycle to change or for it to be something different, but the cycles we see according to the price action of Bitcoin and other cryptocurrencies behave exactly as we saw previously.
So for now, in my opinion, it is better to follow the cycles rather than trying to go in the opposite direction. That's why I think that right now we really have maximum opportunity in the market and it's time to position ourselves, and after that, it's patience that ensures that some people are rewarded and others are not. And in the markets, as in everything we've seen previously, we have macrocycles like we see here and microcycles.
I took this chart from Redalio with his excellent book which talks about cycles where some countries gain the upper hand over others at the macroeconomic level. And here in cryptocurrency, we've been experiencing a macro cycle on Bitcoin since it was created as we can see here in 2009. It's only been going up if we follow a trend over several years and we have microcycles, mesocycles of 4 years and even smaller microcycles.
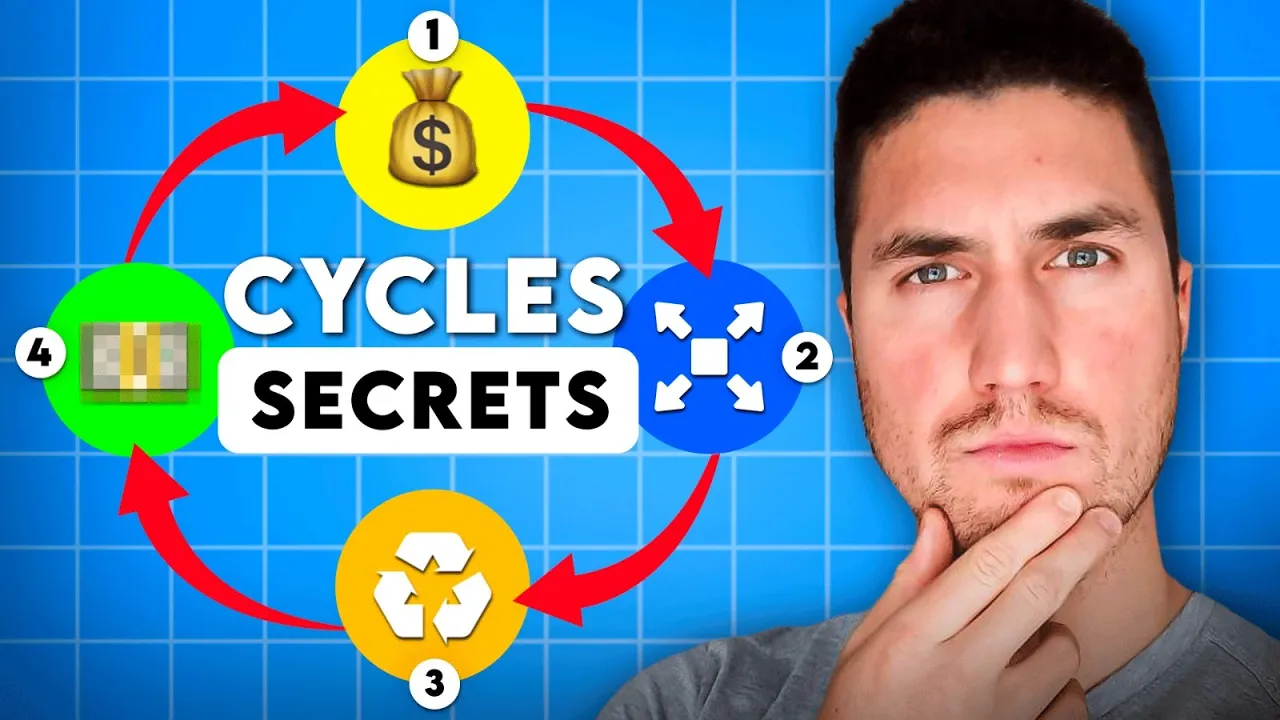
Where am I going to show you exactly how it works in my opinion? So you see the chart here in four phases that I show you how capital moves in cryptocurrency and how to take full advantage of the cycles that last about 6 months to 1 year on cryptocurrencies. I talked about it in my monthly report on page 15, but I decided I was going to give it to everyone.
So if you're interested, click on the link where you can download this image that I recommend you study and re-study for the rest of the story. So how did I get to this image that we see? I think most of you are familiar with the image from Secret of Crypto that I've shown you in several videos, who was one of the pioneers in cryptocurrency to make an image like this, which showed that liquidity was moving from Bitcoin to Ethereum, to large-cap cryptocurrencies , and then finally to mid-and small-cap cryptocurrencies, and the entire market exploded at the same time.
But I think that's over because it doesn't tell us about the corrections that happen in a micro cycle like we see here. This can happen in 6 months, 9 months, and it can be repeated two to three times in a cycle. In my opinion, this is what you need to understand.
Here, I will explain my chart that I have created. So, we start with the flow of capital into the cryptocurrency market. Phase 1 is the entry of capital.
Money mainly enters the market via Bitcoin and Ethereum. Because as you know, all the largest cryptocurrency exchanges, how it works to enter directly from Fiat, i. e.
from fiat currencies to the cryptocurrency market, well, you have to buy either Ethereum or Bitcoin in general to start, except for the largest exchanges. So this causes Bitcoin and Ethereum to increase in price and the number of stablecoins in circulation to increase. So keep an eye on that too.
When you see the number of stablecoins in circulation increasing, it's not for nothing. That means that there are big players who are positioning themselves in the cryptocurrency world to buy cryptocurrencies. And that means that immediately after, we see the major all-coins rising more quickly.
Those that are in the right narrative, as we saw with artificial intelligence or decentralized GPUs with Render or Aash, well, being in the right narrative is what counts. So money is flowing into Bitcoin and Ethereum, the big cryptos are starting to rise quickly, almost at the same time as Bitcoin and Ethereum. And then, we have the mid-cap altcoins that are rising, but especially those in the right narrative.
The mid-cap ones that are not in the right narrative won't rise much during this phase. And then it lasts from 40 to 100 days. And then we have our first correction.
Everything corrects without exception to get rid of the weak hands in the market in the short term. That's called a price capitulation. We're trying to pull the levers out of the system a bit.
And here, I'm going to show you what it looks like on a chart. So, what did we see in 2023? We saw Bitcoin quickly go from $ 15,000 to $ 25,000 from January to the end of February.
Then, we had a huge correction here. And now, if we look at the all coins, what happened? Let's look at an All Coins that was in the right narrative.
Here we see Render, which started to go up, you see, from January 10th. So, with a delay of about 2 weeks, we went up until mid-February, we went up 361%, while Bitcoin went up about 60%. And then we had our first correction that you see here.
We went down 53%in the space of a few weeks. And now, if we go back to Bitcoin, what happened there? Let's zoom in a little.
What did we see? Well, Bitcoin corrected by about 20%and then we had a second bullish surge that saw Bitcoin rise by 60%. And now, what happened to an All Coins in the good category, as we see here with Render?
Well, Render decided, once the first correction was over, to go up by another 200%. So now, if we go back to our cycle, we had our first correction and now we have phase 2 where everyone is making money because now, cryptos with a good narrative like Render are exploding for a second bullish leg, cryptos with low capitalization are starting to rise and it's in phase 2 where you have to take the most profits. People are starting to get euphoric.
New players are starting to enter the market, and that's when it becomes an exceptional time to take profits. So all of this is usually done in 100 days. So you have about 3 months to complete the transaction because then we move into phase 3, where it's still possible to make money, but it's harder to really specialize and understand what the good narratives are.
But before we go into phase 3, I'd like to show you an all-coin that didn't have a good narrative. What did it do during that period? So let's look at Cardano.
What happened with Cardano? We saw it here from January 1st. So this is a large-cap All-Coin.
As I was saying, it went up at almost the same time as Bitcoin and Ethereum. We went up 70%. Then, we had a correction in February and March of 25%-26%and we had our second rise which was only 50%.
So you see, when we are in the right narrative , that's when it pays off. And then later on, that's when things go wrong. We are in phase 3.
Liquidity recycling. That's what I called it. The market is getting boring.
The distribution starts , so people who have made profits, the bins, are starting to distribute, to quietly sell their positions. The all coins are slowly losing value. Investors don't know what to do with their profits anymore.
So they are going to move on to stage 7, investing in small cryptocurrencies. The laggards are starting to arrive. These will be the exit liquidity for the whales who are selling or us warriors who have understood the market cycle.
So when we really look at Cardano, we see that it started to decrease, decrease, decrease and then boom, we corrected sharply. You'll see, this is phase 4. And if we take a cryptocurrency like Render, we have our distribution phase here.
You see, we went up, we distributed slowly, slowly, and then it accelerated, which is point 7 of phase 3. I mean, the MIM coins went up and the cryptos started selling out. Fundamentals, pushed by big influencers, started to go up here and there, boom, boom, boom.
It exploded everywhere because liquidity was recycled towards cryptocurrencies with little liquidity. And that's where we see cryptocurrencies like PP, as you can see, which started to explode from the beginning of April until May 2023. So we had been in our market for 5 months too.
So this is a cryptocurrency that is a meme coin that doesn't really have any use other than trying to make money on it. So that's point number 7. And then we have the return to liquidity.
Point 8, the market starts to slowly go down. Traders are getting impatient. They are taking on increasingly large leverages because traders are not able to tolerate sideways markets after having experienced such an exciting cycle as what we saw in phase 1 and phase 2.
And that's where it starts to get dangerous because leverage means liquidation. So the market corrects sharply. Most altcoins correct by 60 to 80%of their initial rise.
The strongest altcoins make higher highs than the previous ones, except in a downtrend of course, then everything makes lower lows than the previous ones. So let's look at the strongest all coins. So if we go back to Render, we see that Render made a low here around 39 cents in January and made a low around 94 cents in March.
And here we make an even higher low, you see around 1. 30. So this is an alt coin that is strong, that is trading very well.
Whereas the altcoins that were not in the right narrative, if we go back to our example of Cardano, well Cardano is not complicated. We made a low around 24 cents. We have our first correction around 30 cents and here we make a low that is the equivalent of the January low.
So this is an all coin that was not in the right narrative and that is what happens with these all coins for the most part. Except when we really get to a point where liquidity starts to enter the cryptocurrency market in a sustained way. Then we risk seeing higher highs.
But once again, cryptocurrencies in the right narrative will rise more than the others. And finally, we have number 10, a consolidation period of a few weeks to a few months. Where is it that it can be long, it can be flat, but it's time to accumulate.
It really is time to accumulate. That's where we are right now. We're at point number 10.
And what's going to happen? Well, we're going to repeat as you can see here in the image of the circle to repeat phase 1 until phase 4 and possibly we'll experience two more cycles like this before the cryptocurrency market peaks. So potentially we could have a cycle for 2024 that looks like this until the end of 2025 and then we'd have our big correction.
So let's end the video with another incredible chart that I discovered thanks to Alessio Rastani's channel that I recommend you listen to if you like really interesting trading. This is the chart here from Samuel Brenner, which was made in 1875. He was a farmer who managed to predict market cycles, and his chart is still relevant 150 years later.
So it's really impressive to understand that. And you see at the top of the market, we see the years when there was a market panic according to him. So if we look at the dates, it's still very accurate.
We have line B here where we have the good times, where we have high prices and it's time to sell stocks or Bitcoin or whatever asset we're in. And here, you see in 2026, it would potentially be a good time to sell stocks and cryptocurrencies according to this chart. And at point number C, these are the years when everything is tough, prices are low, and valuations are better.
And here, as you can see here, in 2023, according to Samuel Brenner's chart, it would be an excellent year to buy stocks and cryptocurrencies. If we go by his chart, it's quite impressive. What did he manage to predict?
I'll also put it in the document that you can download below and you can analyze Samuel Brenner's chart, which completely amazed me. So I hope you enjoyed the video, that it showed you that nothing goes up in a straight line , that everything is cyclical. And once again, if you're interested in seeing the image that we see right here, don't forget to download the image with the link that's in the description.
And if you're interested in getting market updates on cryptoreche. com, which is my group with Iril now who works and makes exceptional videos, I give you updates almost every day. Well, I recommend you check out cryptoreche.
com. Eventually, we might consider closing the group to keep it smaller. And finally, if you want to know more about what's happening right now in the economy, I recommend you watch my video that I made right here that shows you 10 striking images of our financial future .
So everyone, I wish you a very nice day. I'll see you very soon. Bye!
Bye!