You are losing not because you don't have a proper strategy, but because your charts look like a bloody war zone. There's indicators everywhere. There is no clear structure.
There is no direction. It's just pure confusion. I don't even know how you trade.
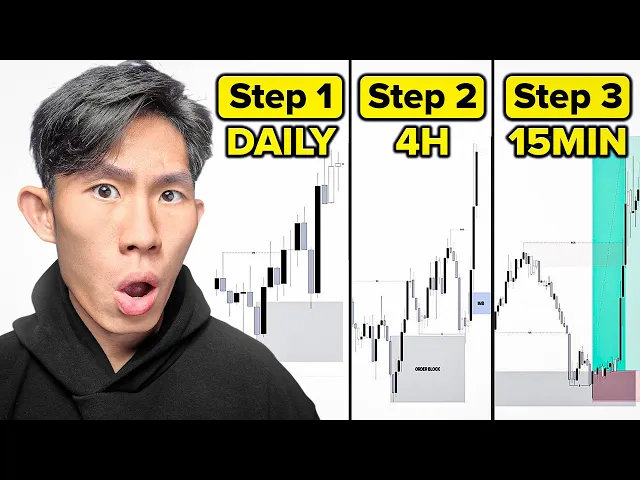
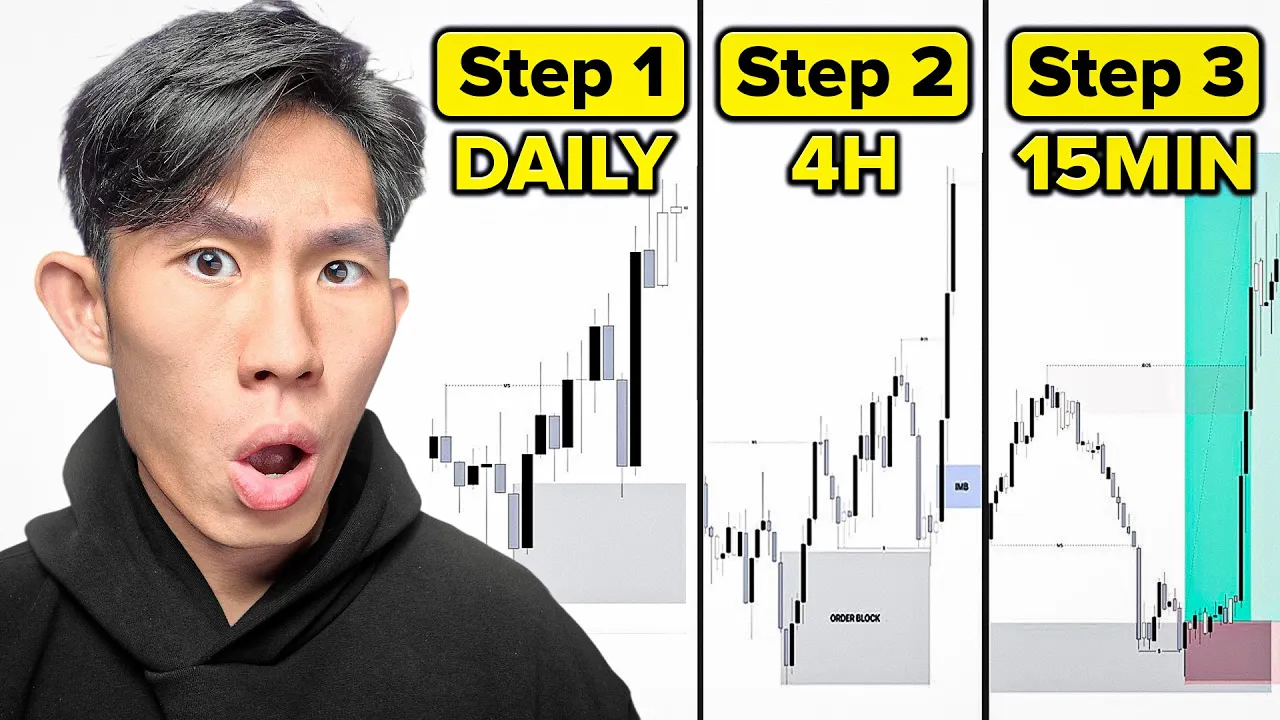
In this video, I'm going to show you exactly how I mark up my charts every single day from the daily time frame all the way down to the five minute time frame so that I always have a clear bias, clean zones, and zero hesitation when pulling the trigger. Now, this is the exact charting process that I use to trade like an absolute machine. Okay?
Like legend has it that even Wall Street traders, they are afraid of me because my entry is better than theirs. Okay? So, step one, get rid of all the indicators.
Okay? I'm serious. Turn them off.
Delete them. If you got RSI, MACD, moving averages, stoastics, throw them in the trash right now. Okay.
But no, no, but Brad, they are valuable. They make me profitable. Bro, you are losing.
What's there to lose? There's nothing left to lose. All right.
So, get rid of them, right? Because they are lagging. They are inefficient.
They clutter your thinking and they distract you from what actually matters the most which is price action structure and liquidity right now I'm not saying that indicators are evil which I believe they are right like who do you think created those indicators smart money right because they want to engineer liquidity but because if you cannot read the raw chart first then there is no point putting them on there and just confusing you even further right So you want to start off with like a blank slate. So do yourself a favor, right click, click this button right here, remove all indicators. Okay, right now it says four because I got like this inside bar like this watermark thing.
Okay, so we start off with like a blank slate, naked charts, beautiful long naked charts, clean candles, just price. All right, that's the foundation which everything is going to be built on. So that's step one.
Now step two is to actually mark up the higher time frame. I use three time frames. higher time frame will be my 4 hour time frame.
My medium time frame will be my 50-minut time frame and my five minute will be my lower time frame. So, you're going to be using your higher time frame, which is the 4 hour time frame to build a narrative. Okay?
So, now that your chart's clean, let's start building out the story, right? The the narrative. So, on a 4 hour time frame, here's what I personally mark up, right?
I want to first identify what is the current swing range. So, this would be the most recent break of structure to the upside, right? So that's obviously my bullish break of structure, which means the lowest point that led to this bullish break of structure, that is my 4hour swing low, right?
So I mark that up as my 4hour strong low just like this. It's a strong low because it led to a break of structure. It led to price taking out this week high.
Okay? So we should be expecting price to create like a higher low somewhere around here and then just continue to go up there and take out this new week high that we have up here. Right?
So you can see just by doing this alone, I've identified the swing range that I want to focus my time, my energy, my attention on, right? So I'm not getting distracted by what's going on here or here in the middle of nowhere. No, I only care about what's going on here within this swing range itself.
Now that's done, you want to actually map out any relevant point of interest in terms of supply and demand zones, order blocks, flip zones, whatever, I don't know, whatever zones, rectangle boxes that you want to draw up. So in this case right here I always start from the extreme. Okay.
So this will be the extreme demand zone. So I can just mark this box right there. Right?
This is my 4hour demand and then I just continue from here. Right? So from here price goes up pullback mitigated this zone and then push back up.
You can see this is a very clear form of mitigation. Right? Which means they have already used the remaining buy orders within this zone itself to fuel the up move.
Right? So this zone is most likely not going to work anymore because it's already mitigated, right? So you just continue mapping this.
Okay, there's another zone right here. But then guess what? Price is also use this one as well before pushing up and let's continue just follow the money.
All right, so you can see there's another demand zone right here which somewhat mitigated as well. And then price comes up there, mitigate this. Oh no, this one is unmitigated.
And then there's another unmitigated zone right here. Okay, so these two zones are the ones that I want to pay attention on. Right?
Price is most likely going to gravitate towards those zones because there's still a bunch of pending buy orders sitting within this point of interest itself. Now remember, I'm not trying to predict the future. I'm just trying to read what the market is already telling me.
I'm just trying to open my ears and open my eyes out to see the objective truth of the market. That's what I'm doing right now. Now that's done, you also want to identify some form of liquidity, right?
where is the most obvious liquidity zones that I need to take into account of where liquidity is sitting at right now. Right? So in this case, I can see that there's available liquidity sitting below this low right here.
Okay? And then there's also a bunch of liquidity sitting below this low right here. Okay.
So obviously you can see this is also like somewhat of like an institutional zone as well because price actually went down there. You can see price created equal lows. Okay.
Let me just highlight it to you. Price goes up, pulls back, goes up, pulls back. Look like a bloody bloss but whatever, right?
And then price comes down, swept the available liquidity from these lows right here before pushing price up, right? So this is pretty much a institution zone that swap liquidity, right? So we know that this is a zone where there is going to be some form of action, right?
And I want to be there when the action actually happens. So now that's pretty much what you do on a 4hour time frame. You are just mainly using it to get your narrative bias, right?
To see whether price is bullish, bearish or in a range, right? Really overall just identifying the higher time frame trend direction. So you can really try your best to trade with it.
Once again, you doesn't have to trade with it, but you can try your best to do so. And bear in mind that I do not drop down to the lower time frame until I have a crystal clear view of what price is doing on a 4hour time frame itself. Now that we have identified our higher time frame narrative, the next step is to actually drop down to your medium time frame to actually further refine your point of interest and really identify where are the areas that you want to enter the trade from.
I personally I like to use the 15-inut time frame as my medium time frame. But with that said, you can also use the 1 hour as well if the gap from 4 hour to 15 minute is is way too large. Now before we go down to the medium time frame, you must ask yourself what is the current objective of price?
We know that after a break of structure just like this, price is going to be creating another swing low before pushing to the upside. Right? So right now where is price at right now?
What is price trying to do? Price has shifted bearish on the lower time frame to facilitate the higher time frame swing pullback. Okay.
So if I jump down to my 15-minut time frame right now, I should see price creating lower highs and lower lows on the internal structure. Once again, it's not because price is in a downtrend, but it's just because price is shifting bearish in the short term to facilitate the higher time frame swing pullback. Okay, remember price is fractal.
Whatever happens on the higher time frame must first happen on the lower time frame itself. Now, let's go down to the 50-minut time frame and look at what we have. We saw that the internal structure was like creating higher highs and higher lows right here.
And then later on price goes down take out this last internal high low giving us a market shift. And after that supply overpower demand and it's just creating lower highs and lower lows just like this. Okay.
So right now at this of time if I'm an intraday trader, if I'm a sculper, I'm going to be trading with the internal orderflow, right? Which is bearish, right? So even though the higher time frame order flow is telling me to enter for a buy and all that stuff, remember you want to trade with the internal orderflow until the sentiment and the bias changes, right?
All right. So, in this case, I want to continue riding this move until this bearish move started changing bullish and I can look for longs. If not, I'm just going to be continue trading with the smart money.
Just going to continue following the money, continue following smart money's footprints. Okay. So, in this case right here, we on the 50-minut time frame.
This is where we can see that price is obviously creating lower lows and lower highs. And that is where you want to look for sells at supply zones, right? Because that is just you trading in accord with the internal order flow.
Okay? So this is where it gets really really useful if you try to actually map out your internal structure to find your internal range. Right?
So we got a market shift right here and after that later on price gave us like internal breakup structure just like this and you can just follow this all the way down until we get the most recent internal range right here. Okay. So this is the most recent internal break of structure which means this is my 15minut internal or rather my 15-minut strong uh lower high and then this is my 15minut week low right just like this you can see what happened magic hey so what happened was that just now on the 4hour time frame we got such a wide area to focus on but right now just by mapping our 50-minut internal structure and just really refining uh everything you can see we have narrowed our time, our energy, our attention into this tight range of how many pips is this?
Whatif 50 to 60 pips, right? Pretty decent. Yeah.
So now, like I said, anything that is outside of this internal range is noise. Okay? Anything outside of this is noise.
Now, what's going to happen next is that you want to also mark up your 50-minut supply and demand zones, your point of interest, right? So in this case you can see I don't need to mark all these supply zones right here because right now price is only within this range right. So I zoom into this range itself.
I start off from the extreme right. So this is the extreme supply zone right here which once again we know that price has to hold in order for this internal structure to remain bearish. Okay.
So in this case I want to be looking for shorts at this area here. Right. But before you jump into that, jump into entry and stuff, you can also, you know, draw your premium discount really get as much confluences as possible.
Okay? And really once again identify available liquidity, right? So in this case, I know that there's liquidity sitting above this last fractal high right here.
And then there is also available liquidity sitting above this highs right here. Okay? So you can see once again there's multiple liquidity points, right?
Multiple places where there's a bunch of stop- losses are sitting at. Okay? Okay.
So at this point of time, I personally would set an alert at this edge of this point of interest itself, right? This 15-minut supply zone. So I wouldn't do anything until price mitigate this zone and my alert goes off.
So if price is over here in the middle of nowhere, I don't care, right? I know that I'm not trying to enter for a long here yet because internal is still bearish, right? And there's no confirmation that proved to me otherwise.
So whatsoever. So, I'm just going to be patiently waiting for price to come up to this point of interest right here, my supply zone that has available liquidity sitting near it. And then I want to wait for the alert to go off.
And then once it does, I go down to the lower time frame, the 5m minute time frame to look for my entry model once this point of interest is mitigated. So now at this point, I already developed my bias. I know what I want to trade.
I know where I want to enter the trade on. So it's just a matter of waiting instead of chasing price. I want to wait for price to come to me.
And this is where so many traders mess up, right? They start entering right here in the middle of nowhere, start taking a bunch of low property trade setups because they are trading for the sake of making money, right? They are trading for the sake of bottom and they are not actually trading because they want to execute their plan to a tea.
And that's the difference between you and me and that's the difference between you and consistently profitable traders, right? We understand that trading is freaking boring and we just wait for the opportunity to come to us, right? So in this case, price goes up there, mitigated this point of interest, trigger off our alert, boom, this is where I go down to the 5 minute time frame, my lower time frame, and I start looking for my entry.
Now we hunt baby. No, not Han babies, right? But like Han stop losses.
Okay, so in this case right here, you can either choose to enter your trade on the five minute or the one minute. I would advise you to stick to the five minute especially if you're a beginner because the one minute can be super duper confusing. All right?
Especially if you don't have experience whatsoever, right? So stick to five minute. So this is where like I said, I want to look for my entry model.
I have two types of entry model. My aggressive entry models and my conservative entry model. My conservative entry model require me to wait for some form of market shift.
Right? So in this case I can see that the internal structure is still bullish. Right?
Because once again if it wanted to facilitate that that that pullback from this uh 15-minut bearish move right so in this case right here the market shift will only happen if price take out this low right here and that will be the confirmation that I need to actually enter the trade knowing that this pullback is over and price is going to continue to push down even further right so that's the conver conservative version another version that I never really talk about on this channel itself but I talk to my students a lot about is the aggressive version, the aggressive version of the entry model itself allows you to actually get in and actually miss less trade opportunities and actually like sometimes even get in like at a pretty good decent uh risk-to-reward ratio because a lot of times I notice for the conservative version is that you know you got a market shift and then wait for price to pull back to this point of interest and sometimes it doesn't pull back it just goes it just flies right that is why nowadays I've been using the aggressive version of the entry model a little bit more but once again it depends on the market scenario you want to use it at very high property environments and not just any environment. So in this case I'll deem this as a high property environment right because of multiple confluences pointing out that this is indeed that um extreme point of interest. This is aligned with our internal orderflow and we also got a bunch of liquidity just sitting above it.
Right? So in this case right here you can see price comes up there swept the liquidity above these highs. This one has already been swept by like this move right here.
Okay. So once you got a strong liquidation, that is where I'm looking to enter. That is my aggressive entry model.
Strong liquidation at some form of high property point of interest. So now you might be wondering where am I actually entering on this trade itself. In this case, I'm looking for the liquidation candle.
Now where's the liquidation candle? It's going to be this candlestick right here because this is the candle that went up there that swept all the available liquidity trigger all the stop loss of retail traders. Right?
So we know that this is clear as day institutional movement. It's it's like this is like the trap that is laid out by retail traders and then this is them taking in the the fruits of the labor. Right?
So this is where I find a liquidation candle and I place my sell stop order right below this liquidation candle itself. So once price goes up there goes down there and trigger my sell stop order. I will tap into the trade and this is where I'll place my stop loss above this long week right here or above this point of interest if you want to be safe.
And then I place my takeprofit at the most nearest demand zone, right? Which is in this case right here. Or even at the most nearest 15minut week low, right?
Because bear in mind what is price trying to do right now. Price has literally pull back to this point of interest right here to create like a new lower high which it did right here. And right now assuming that this internal bearish structure is going to continue, price is going to come down and take out this low and just continue crashing.
Now let's look at how this beautiful trade plays out, right? Price goes up, pulls back a little bit, and ultimately it started crashing. Okay, right now we are in the green and then boom, we smash our TP just like this.
Now bear in mind that this is not a trade that I cherrypicked on hindsight. This is an actual trade that made me $36,000 which I documented from the start till exit of my second channel, Brad Trades. Yo, I'm full porting, lads.
I'm full porting, mate. So I just entered for a sell right here. place my stop loss right above the liquidation candle obviously.
Yo, how much are we up right now, bro? Let me just show you real quick. It's been very long since I do this man.
25 bands in June. Oh, look at him just fall, bro. Oh my god.
This is satisfying as hell, bro. This is actually very satisfying to watch. So, there you have it, lads.
It's been so long since I shared with you guys, but we made about 36K today. If you watch the full breakdown of this live trade in real time, you will see that I wasn't hoping. I wasn't moving my stop loss or moving my takeprofit whatsoever.
I just let the trade do its thing. Like if it hit stop loss, cool. I'm moving on to the next trade.
But if you hit take profit, then cool as well. I'm just going to journal and reflect about what I could have done better. Right?
So in this case, I know that maybe I could have just let it run all the way due to my TB instead of taking the trade off before I go to sleep. But at the same time, that kind of goes against my plan as well. But anyways, right, you can see this trade right here.
It was extremely mechanical, extremely systematic. There was no feelings. There was no uh hesitation or guesswork whatsoever when I enter for this trade because I've already done my preparation.
I've already done my analysis before I even enter for this trade. I know exactly where I want to get in, where I want to get out if I lose the trade, which is my stop loss, and where I want to get out if the trade actually go in my way, right, which is my take profit, right? So, as a result, there is no uh emotions whatsoever.
So, yeah, that's the full charting flow that I use every single day for the past one year or so. And it's no coincidence that this past one year is the year where I made the most amount of money from trading. Like I say, it's just mapping out the 4hour high time frame narrative, going down to the 50-minute point of interest to further refine your zones and find out your your internal structure and then later on going down to the 5 minute to actually execute a trade and then just just let the system take over, right?
No emotions, no guessing whatsoever, bro. Remember, if your charts are clean, your mind is clear, execution becomes automatic. And that's what separates consistent traders from the the ones that are chasing bloody sickness.
So, if you got value from this, right, just comment below and let me know whether you want to see more raw and unfiltered trading tutorials just like this because I honestly love doing them, right? Uh like it makes me feel very fulfilled doing this speaking to my younger self. Now, if you want to learn this entire mechanical trading system properly with real-time markups, entry models, and feedback from me and my team of veteran traders, it's all inside the 1% club.
So you can just click the link in the description to apply and join right now. The only reason why I have so much conviction and confidence in my mentorship is because of the results we have gotten for our students. Like this is genuinely the best trading program out there that focus on getting students results, right?
So you can just go and apply if you want. If you don't continue watching this YouTube videos for free, but if you want to fast track your growth, shorten your learning curve, go and apply right now. And as always, remember you're just one trade away.