What's up everybody? Rob Swanson back here with module three of the virtual flip system. In today's system, we are going to take the market research and the analysis process that we have been building on from the initial introduction of the program and this system into the deep research process that we learned in module number two. And now we're going to assume that you have selected a market or your top three markets and we're going to grid that market and break this down and get specifically detailed in our ability to find those honey holes and really
laser focus in on flipping deals virtually across the country. Now, what we're going to do to do this is uh a process that I have been using for the last decade. And I can think back when I first got started and and needed to do this. I had to go in and and get data out of the local uh MLS system. So, I had to talk with real estate agents. I had to uh figure out how to download data. I had to import it into spreadsheets. I had to I had to use formulas. I had
to do all of this fancy crazy stuff. And you're not going to have to do any of that. Everything that I'm going to be teaching you and showing you today, you can do on your own the hard way if you want to. I'm also going to be showing you the easy way to do it. And the easy way to do it is to let the technology essentially do it for you. So, uh, you're going to have the ability to have it done for you inside of your Freedom Soft account or learn the process and you
can go run all of the analysis on your own. And either way is is fine. You can choose the way you want to tackle this. So, we're going to be diving into the virtual flip system module three, which is called finding honey holes. And as we dive in and just sort of review where we've come from and review where we're headed, let's see how this module fits into the big picture. In module one, we did what I like to call the quick start guide or kind of the system overview because I find it's really helpful
for you to know where we're headed at the beginning so that as we take the steps along the way, things make sense. Now, in module two, we dove deep into market analysis, market research, and ranking what I call easy profit cities. And the reason we did that in such a great detail is because it's the crux of the system. If you get in the right market in what I call an easy profit city, then what we're going to be doing here in module three is a whole lot easier and it will produce a whole lot
better results. And so this system builds on itself ranking easy profit cities. The thing to remember about that is that there's no one city that is the number one ranked city in the country. Easy profit cities are about finding cities where the speed to lead, the speed to deal, and the costs per deal are the lowest. And so there are there are cities that are easier than others. Uh and that's what we're trying to find. We're trying to find those easy profit cities where the work we do produces results most consistently fastest. Module three is
our market analysis module. That's the module we're in here today and it's all about finding the honey holes. It's it's all about finding those hot pockets and pinpointing inside of a market to say where is the money being made. The thing you want to be able to answer in this module and at the end of this module is a simple question. Where is the money being made? And by diving into this market analysis and doing what we're doing here today, you're you're not only going to be able to answer that question, but you're going to
be able to take the data that we produce and use it to make offers very quickly, very efficiently, um, in markets that you don't know much about the market. And you'll see exactly what that looks like and what that means as we dive in. Now, module four is our acquisitions uh module, and we're going to show you how to do virtual deal analysis through acquisitions. And uh you're you're going to love that module. Um it makes doing deals virtually in markets that you don't know that much about very simple. and the process that we go
through. Uh the way you're going to get your boots on the ground, uh the way you're going to prep a deal, uh whether it be on the phone talking to the seller or after the fact and doing your due diligence and your analysis process, uh you're you're going to love the process uh in module four. Module five, our dispositions and getting paid module, right? This is the this is where the rubber meets the road. You can't you can't get paid without a deal. You can't uh have a great deal consistently without a process for acquisitions.
Uh acquisitions is harder in the wrong city. And you're going to see that how all of this builds and serves together. So module five is our dispositions module and getting paid virtually. you know, how do you do this when you don't have a local connection? Uh, how do you do this across the country? We'll break that down. Module six is then building your team and scaling nationwide because everything we're talking about here and everything we're building here has the ability to be scaled as much or as little as you want. And so, we'll be diving
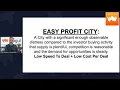
into all of that. As a quick refresher, an easy profit city is a city with a significant enough observable distress compared to the investor buying activity that the supply is plentiful, competition is reasonable, and the demand for opportunities is steady. That's an easy profit city. you're you have a low speed to deal, so things happen fast, and you have a low cost per deal, so your marketing is cheaper. When you combine those two things in a nice balance where there's lots of buyers and lots of deals, that's what we call an easy profit city. Now,
the objectives of this particular module, and I'm going to be diving into the software here in a minute and just walking you through this process. The objectives of this module are to grid a city and find the honey holes. Uh, this is known, this is something that I've called and has been known for years as the pinpointing technique. And what we're going to use is data to hone us in on where the money is being made, where are investors doing deals, and where is the money being made. You do not need to be the pioneer
uh in an area. And what I mean by that is a lot of times I talk to real estate investors. I see real estate investors trying to do this thing and they've got a deal on the east side of town and uh the buyers are buying on the west side of town and they can't figure out why nobody wants to buy their deals. And it's because you're not getting your deals in the areas and at the price where buyers are actually buying those deals. You want to pinpoint. You want to overlap. You want to find
those that sweet spot I call the honey hole. And you want to find where the activity is happening along with the where the distress inventory exists. When those two things come together, uh you have a winning recipe for consistent deal flow and consistent paydays. What we're going to do is we're going to find the the top zip codes, the top price ranges, the hottest areas, and the most cash buyers. When all of those ingredients come together in an optimal ratio, you win and winning becomes more simple. Here's one of the cruxes of this. We're going
to identify where, what, and how much investors are paying to buy investment properties in a particular area. Now, when we get into the buyer module, which is module number five, we'll get into the who. Who are the buyers? How do we find them? How do we make connection with them? Today, what we care about is where are they buying, what are they buying, and how much are they paying? And when you know the answer to those three questions, you have successfully gritted a market. You have successfully created a grid of opportunity. You are now going
to be laser focused in your marketing to get deals fast. You're going to be laser focused in your marketing to get deals cheap. You're going to get you're going to be laser focused to get deals that that other investors actually want to buy from you. This solves the problem of having a deal on the east side of town when all the buyers are buying on the west side of town and not understanding why nobody wants your deal. We're going to bring these three things together, where, what, and how much, and basically put the recipe in
your lap. This narrows your focus so you don't waste time, energy, effort, or money, which is an absolutely key component. Only go after the kinds of deals that investors actually want to buy. So, with that, let's do this. Let's jump in to Freedomoft and let's start taking a look at the data. Um, in the module number two, we went through and we ranked some cities. Now, I'm going to go ahead and I'm going to pretend that uh the market that we ranked uh was Memphis, Tennessee. I've bought and sold a lot of real estate in
Memphis. I own real estate in Memphis. Uh I've wholesaliled a lot of real estate in Memphis. I know Memphis very well. Um and so I'm going to pick the market of Memphis, Tennessee, to begin this gridding process. I'm going to assume that Memphis is an easy profit city. Now you could run this analysis that I'm about to show you on any city in the country and just remember that we are going to start in module two which is ranking of the cities and then go to the gridding process. How do you grid a city? Well,
you can grid any city in the country in the process I'm going to be teaching you here today. That doesn't mean it qualifies as an easy profit city. So, you still always want to go upstream and rank your market first and then go through the process that I'm teaching you here today and go through the grid process or the pinpointing process. So, we're going to go into Freedomoft and I'm going to go select the market. I'm going to go down to Tennessee. And what I always like to do is I always like to search my
geography by MSA. Now in the market research uh module I talk to you about the different categories of geography from state to MSA to county to city to zip code to census track and they get smaller as you go. This is one of those places that once you've picked your city, your market, this is where you want to stay broad because you want to grid that entire metropolitan area. You don't want to bring you don't want to bring a bias into uh your analysis process. And now this is especially important if you happen to have
local knowledge of an area. Maybe you live there. Maybe you lived there in the past. Maybe you know the market for some reason and you think, "Oh, I I know where all the investors are buying." And you bias yourself into a a particular area. So you go in and you say, "Oh, you know what? I know I want to be doing this in XYZ city or oh, I know that I know that I want to be in these three counties." That brings bias. That brings your own opinion into the analysis. And you don't want to
do that. You want to stay broad and let the data guide you. So the MSA, we're going to pick Tennessee. We're going to we're going to leave this checked as MSA and we're going to go down here and we're going to select the Memphis MSA. Now, I always like to go and change this uh time frame to the last 180 days. And I click search. Now, the reason I do the last 180 days is because, uh, in general, counties tend to be slow. Uh, and the updating of the public records in certain counties is worse
than others. And so, a county can be 30, 60, 75, even 90 days behind. And so, sometimes if you pick a a time frame of 90 days, uh, the data is pretty small. I like to go back 180 days. That's six months back. And usually I have three pretty good months of updated data. And then you and oftent times in the bigger metro areas I have six months of good data. But that's why I like to do that. So what have we just done? Let's answer that question. What we just did is we analyzed the
top investor activity zip codes in the me in the greater Memphis area over the last six months. And we ranked them or we sorted them. Let me let me not say ranked them. These are not ranked. They're sorted by the most active zip codes to the least active zip codes when it comes to investor purchases. So, we now know inside of the Memphis MSA, we now now know where investors are buying. And we can see that right here, 38127. If I click on this, it pops up and it shows me that over this six-month period
of time, there were 262 investor sales. 262 investors bought investment property in that zip code in the last six months. Now I can go to the second one and I can see 38109. I can go to the third one. I can see 38118 and I can see the number of investor transactions or in you know investor closed deals uh from 38127, 109, 118, 128, 111, 114. I can see the top however many 50 zip codes in the Memphis area and it just goes down and down and down to hey there's zero investor uh transactions or
investor sales down here in this 38046. I'm not even sure where that where that is exactly um because it doesn't even map it. Here's one all the way down here. Uh, you know, way out in the middle of nowhere in kind of the sticks. And we we really don't care about those ones down there. What we care about in general are the top 10 zip codes. Okay? We care about the top 10 zip codes. Now, we're going to come back to this in a moment. And uh in order to proceed though, you you now have
an idea of okay, where is this happening? If I go over to the map and I just zoom in to Memphis, well, I can see that in the northwest, 38127 is the northwest part of Memphis. 38109 is the southwest part of Memphis. 3818 is kind of the south central uh part of the Memphis metropolitan area. I can start to see the the pockets in where these where the activity is. I want to just know the geography. Now, I'm going to do this. I'm going to click this analyze market button. and I'm going to name the
market and I'm just going to call this uh Memphis MSA and I'm going to click analyze. Now, here's what's happening right now. The market is being analyzed and all of the investors sold activity that uh that is uh happening in the market is being analyzed and it doesn't take that long. Let me just click uh let me just refresh the page here. Might be able to click there. Yeah, it looks like okay, it's already been analyzed. Status has been analyzed. It was pending at first. It doesn't take very long. So now I'm going to click
into this Memphis MSA market. And here's all the sales data that is that is being analyzed. Now, in general, well, not in general, specifically all of this is investor uh these are investor sales only. And you'll notice something, and I wanted you to see this because I think this is great. uh th this $8 million for this, you know, four bedroomedroom, two bath, two-bedroom, two bath, threebedroom, one bath house. This is basically a fund that is blanketing a large loan or uh their cap, their funds capital. They're recording a lean and setting the sale price
high to protect themsel. Freedomoft is already analyzing that and it's already scrubbing out these outliers. Okay, we're we're looking at all of the data and saying, is it an absentee owner? Is it an investor deal? Is it an investor sale? Uh we're looking at it and we're saying, is the data accurate or is it an outlier that needs to be scrubbed because it's skewing the math and it's skewing the data. Okay? And so you'll see some outliers and then what Freedomoft will do, Freedomoft will naturally scrub those outliers so that they don't get analyzed in
the data itself. And so you might be asking yourself, well, what what data are we trying to figure out? Like what uh what are we trying to analyze? Well, from the pricing data tab, let's go over here to the offer generator tab. This is what we're trying to get to. Okay, we're trying to get here to this zip code, bedroom, bathroom, and price per square foot analysis. Okay, let me explain what's going on here. In every zip code in the country, there is a zip code or a neighborhood or an area. There's a geography. Okay?
We use the zip code as the geography because it is the most consistently usable geography uh to build data around. Uh it's it's the most accurate without spelling errors, without um just very very skewed data. Okay. And here's what we're trying to do. We're we're taking all of the data in every zip code and we're breaking it into the different configurations of what types of properties are being bought and sold. So you can see on this top zip code here which again these are these are sorted uh not necessarily in order of activity but they're
sorted in um uh right now they're sorted in number lowest to highest. So I can see that in 38002 a threebedroom onebath house bought by an investor bought by investors is being sold or is being bought at $71.50 per square foot. So investors are paying for a threebedroom one bath in this zip code $71.50. Now I go to the same zip code and I can see that a different configuration of of property jumped up quite a bit and it jumped up to, you know, a threebedroom, two bath in the same zip code is selling for
$163 a square foot. Okay, now here's here's here's what we don't know. These are these are averages. Okay, we these are average numbers. What we don't know is the condition of all of the properties because the variables uh the the variable in in this type of an analysis is oftentimes um driven by the condition of the property or the repair cost estimate. How much is it going to cost to repair a particular house? And so we're going to look here and and I like to just go through this and say, okay, do do these numbers
do they generally look like they make sense from 7150 to 16342? Well, I don't I don't know off the top of my head if that makes uh complete sense yet. I would have to go in and look at at some properties and start to build my offer generator. Okay. But what I'm going to do is I'm just going to work down this list and see is there anything incredibly off. I see that a threebedroom one bath is 71 bucks a foot. A threebedroom threebath is 99 bucks a foot. And a 32 is 163. Like I
might go in here and I might just say, you know what, I'm going to override this because I'm not sure. And I might come in here and just put this down to $76 a square foot. I might split the difference sort of and and override my math. And then I get to the same zip code, a 34, jumps up a little bit, 35. Now these are these are starting to all sort of make sense. Here's an outlier, a 46 for pretty cheap. Uh, that one doesn't necessarily make sense. So, I might come in here and
override this to $116. Whoops. Not 16 1165. 116. Okay. Now, I'm going to go down through my zip code analysis, and I'm just going to look for really, really strong outliers like that. those those ones jumped out at me. You know, this this one jumps out at me in 38 uh 017. Here's what I'll do though. Um usually what I will do is I will start with and let me see if I have that tab open uh here. Um usually what I'll do is I'll start with my top 10 zip codes. So, let me go
back and open up uh Zipfinder. And let's see. I'm gonna open this in a new tab. I'm going to go pull ZipFinder back up. Uh because I was in presentation mode, it didn't open me a new tab. And I want I want that tab to be able to show this to you. This will go pretty quick since I just ran it. I'm going to move this. And there's my 38127. This is the top investor zip code. Okay, we already know that. So, what I would like to do is I'm going to come to my offer
generator back in the uh market analyzer and I'm going to go down and find 38127. So, 38127. There we go. I got it right down here. And I'm going to look for outliers here. And why am I doing this? I don't need to do this in every zip code because I'm going to be focusing my my effort in the top 10 zip codes. Okay? I'm going to be focused focused in on the top 10 zip codes, not every zip code. And so, let's start here. We got a two-bedroom, one bath for 74.27 a foot. Uh
price per square foot. A 22 for 53, a three, a 23 for 74. So these are these are pretty close. These twobedroom houses, two bedrooms are selling for 70 74 bucks a foot. So I'm going to just override this one to $74 a foot. Then I'm going to come down here at my three bedrooms. 83, 81, 76, 85. Okay. What I like to see sometimes are these anomalies where, you know what, the three-bedroom, three bath is is is pricing a little bit lower uh than than all of the rest, but they're pretty tightly configured within,
you know, five percent or so. Pretty close. So, nothing really to do there. So, here's an anomaly. Here's a $47 when all of the other four bedrooms are in the 70s, five bedrooms in the 69, 70 to 71. So, this one is a little bit of an anomaly. The thing that usually creates the anomaly is a property or two that is significantly distressed and some very low prices. Okay, some very low prices. So, I'm going to go in and I'm going to override this and I'm just going to put this at $70 a foot. So,
I've just taken my top zip code and the configuration from zip code to bedrooms to bathrooms and I've now created a square foot a price per square foot for each property configuration in each zip code. Okay. If I look back on here, the second top zip code is 38109. Let's just go do the same thing. 38109. There it is. Let's just look here. Are there any real big anomalies? Is there anything that jumps out at me and says this is just probably wrong or it's not that it's wrong, but is this an anomaly that is
skewing the data for some reason? And you know, I've got all these fourbedroom configurations. 86 80 58 68. Here's an anomaly. 215. That's not That's not normal. That So, and I got a four bedroomedroom, three bath, a 44, and a four five 68. As the property gets bigger, the price per square foot probably goes down in an investor area, right? The as the a four bedroomedroom, five bath is probably bigger than a fourbedroom, three bath. So, it makes sense that the price per square foot as the property gets bigger will trend down. So, 68 bucks.
This one is an anomaly. I'm going to override this and I'm going to call this uh I'm just going to call it 55. I'm going to split the difference and I'm going to say that our data is correct and down to 35 bucks a foot. 55 bucks a foot. 68 bucks a foot. 58 the because these are probably pretty close uh in size. A 42 and a 43. A 41 little bit uh little bit smaller. So the price per square foot probably goes up a little bit. Everything here looks pretty good. So I'm going to
do one more zip code. 38118. I'm going to go right here and I'm going to do the same thing real quick. I'm just going to look down through this here. Here's the thing. You're not looking for perfect because there is no perfect because we're we're taking we're taking big raw sets of data and we're just sucking it in and we're analyzing it on a price per square foot and property configuration basis. You're not looking for perfect. You're just looking for weird outliers. This is the data. The data is correct. If you were to go export
this out of a local MLS or export it out of a county uh somewhere and put it into a spreadsheet and analyze the data, you're going to get these numbers. Now, what what we've done is we've gone through and we've we've scrubbed and analyzed the outliers. We've gotten rid of the outliers already. So when a fund buys and they and they jack the price or when when different really weird outlier things really high or really low, we've already analyzed that data and uh put standard deviations in place to to to normalize the data and get
it accurate. If you're not using Freedomoft's market analyzer to do this, you will have to scrub out your anomalies out of your data and you're going to get something that looks very much like what we have here. So everything here is looking pretty normal. Um, as the as the size of the configuration gets larger, the price per square foot gets a little smaller. Like this is classic. This looks normal. A two-bedroom, one bath, uh, price per square foot of $80 a foot is a little bit more than a 22 because a 22 is a little
bit bigger. So, the price per square foot goes down. A 23 is a bit little bit bigger. Again, the price per square foot goes down. That this makes sense to me. Um I'm going to look here for any anomalies. Here's an anomaly. This three-bedroom, four bath dropping down to $54 a square foot. Um, but we can also see that as we got into a 43 right here, a 42 to a 43, this also dropped down. We see a pattern. I'm going to go down here, a 54. We see the pattern drop again from 80 bucks
a square foot down to 48. So, I'm not going to adjust anything here. I'm going to let the data be the data. The pattern makes sense. It generally it generally is good. And again, there is no there's no perfect. Okay, you're not you don't have to look for perfect. You have to look for does it make does it generally make sense? Okay, so now we've gone through and we've analyzed the data in the top three zip codes. What I would have you do is do that in the top in your top 10 zip codes. What
you're trying to do, let me flip back over here again, is you're you're you're trying to go in and in this override column any anomalies that you see that need to be sort of fixed in the data, you want to go in and you want to apply those fixes. Okay? And you're just gonna click the little edit button and put and punch in the number to apply the fix. Okay, you're going to do that in the top 10 zip codes. Now, here's why you're going to do that. So, we now we because we now know
we know where investors are buying. We've just pulled in all of the pricing data. Freedomoft did it automatically. Pulled in all the pricing data, scrubbed out the anomalies, and broke down a price per square foot zip code and bedroom bath configuration. this is what you're trying to get to in your top 10 zip codes because then you're going to go back here to your uh zipinder results. This is where you clicked analyze market. Now you're going to come in here and you're going to select the top one, two, three, four, five, six, seven, eight, nine,
and 10. You're going to go pick the top 10 markets. Now, I what I'm going to do is because I just did the override for the top three, I'm going to just limit my selection right now to the top three. I'm going to pick my top three zip codes because that's where I did my override analysis. And I'm going to click find sellers. And when I do this, you guys will be familiar with this already because we did use this data uh in the module two in the market ranking process. But we're gonna start with
the observable distress. And we're going to say, "Hey, in the top zip codes, build me a list. Build me a marketing list of all of the vacant property." Now, you can build tired landlord list, high equity list, distant landlord list, vacant property list. You can say, "Hey, show me all the tired landlords." and then show the advanced and say, "But only show them to me if they're also vacant." So, you can you can do a lot of uh pretty cool things as you get accustomed to understanding how this data works. So, we're going to start
just with the vacant. Let me just make sure that I've got that selected right. Yep, I everything is good. I'm going to click the search button. What Freedomoft is doing is now analyzing the data and it's saying, "Hey, in these I just picked the top three zip codes. You're going to pick the top 10, but in these top three zip code areas, go find me all of the vacant properties." Okay, so we've got 1,424 vacant properties here. Now, I'm going to select all. I'm going to select all 1424 and I'm going to add to a
lead list. Now, I'm gonna create a new lead list here, and I'm gonna call this Memphis uh top 10 zips. Well, here I did top three zips. You're going to do top 10 zips vacant. And I like to I like to put an S out front of this because I know that this list is a seller oriented list. This is a little uh uh OCD thing that I like to do. I like to just make it really easy for me to look at my list name and see, oh, this is a seller list, as compared
to a buyer list, which will uh build as well. But we're going to start here, and I'm going to let this list build. Now, while I let this list build, I'm going to go back to Zipfinder. Okay, back to where I selected my top three zip codes. Remember, I I I ran this analysis and then I first clicked analyze market and I did I did the analysis of the market itself and I and I fixed the override numbers. Then I came back and I said, "Hey, find me all of the motivated sellers or the sellers
in these top zip codes that have observable distress, i.e. a vacant house. Now, I'm going to go do this. I'm going to click in the same top zip codes. I'm going to go find all of my active buyers. I'm going to click search and it's going to go search and it's going to find me. He had just found me in my top three zip codes. And you can see where those top three zip codes are. Remember when I clicked on the bubbles, it showed the northwest, the southwest, and kind of the central south central. And
you can see these buyers are grouped in these areas. So what am I going to do? I'm going to click all pages. I'm going to select all 603 and I'm going to add to a lead list. I'm going to click new lead list. Now, this one I'm going to call a buyer list. And I'm going to go um active buyers top three zips. Um let's see. And I'm going to put active buyers me Memphis active buyers top three zips and I'm going to click create list. Now, while the active buyer list is being built, let
me go back over here. And look, my Memphis top three zips vacant has now been built. My list is built. I've got 1424 new properties here on this list. Okay, let's click into these because let's start asking the question, well, what do we have? Um, I'm going to show you how I like to set my Freedomoft uh list view up. I like to see uh this generated offer price. Oh, this one will come in handy in a moment. Okay, I like to see the Freedomoft pipeline. So, what list, campaign, or workspace is this associated with?
This just allows me to have a glance and see what am I dealing with. Um, I'm okay with source being here. To be honest with you, I usually get rid of it. I'm going to go over here. And if you look at for this little gear right here, you can click this little gear on the right hand side. And I'm going to take source and I'm just going to drag it out of there because I really don't I really don't need source. So I wanted you to see how you can customize this um list view.
Then I click save changes. So now I've got generated offer. This will become handy in a second. I've got pipeline. So I kind of know where is this lead or prospect coming from? What list did I build? What campaign did it come in from? I can see that at a glance. And then I can see my status. Okay, that's those are my first three things. Then I like to see the property address right here. This is the property address. And then this is the mailing address. Now, here's what I generally like to do. Um, I'm
going to go ahead and I'm going to clean this up again. I'm going to click this little gear on the right and I'm going to get rid of mailing address because I don't really care about the mailing address. What I do care about is the mailing state. Now, here's why. Because I can see now that the address I know that the address is in Memphis area. I can see the zip code right here, 38109. So, it's 1637 Florida Street. I already know it's in the Memphis area because look, this is the Memphis top three zips
that I built. But I do want to know what zip code, what zip code is it in. So I like to have my zip code as a column and then I like to see this mailing state. Now the reason I like to see that is because I can quickly pick out any of the absentee owned properties or the absentee out ofstate owned properties. They're all absentee owned because that's the list I built. But I want to see okay, Greg owns this one in California. He lives in California. He owns this property in Memphis. Uh Muhammad
lives in California. He owns this property in Memphis. This is how I like to see my my uh list view. Now, uh what I'm going to do then is show you something. Let's just click into this top one right here. Top three zips. Let's click into this record and let's see what we have. What do we know about this? Well, let's go ahead and and pop the snapshot up. So, if I X this out, I'm clicking this blue view snapshot button right here. And I kind of want to see what what is this? Well, this
one looks like uh this one looks like it's probably a vacant lot. Uh if let's see. This is an absentee owner vacant. My guess is that this uh had a house on it um and it got tore down and it got demoed. Um even and this this Google image, I don't know how old this Google image is, um but I'm guessing this is potentially just a vacant lot. Uh it was bought in 2021 for $5,000 um by somebody that lives uh in in the Memphis area. Okay. So, I'm gonna I'm gonna I'm gonna look at
this one. Uh but let's go ahead and uh let's just go to the next lead. Okay. I'm gonna I'm just going to mark this one. I'm going to color code this red. It's a It looks to me like it's a vacant lot. I'm not interested in vacant lots. So, let's just go to the next one. And okay, this one is owned by the city of Memphis. Let's view the snapshot. What do we got here? Okay, this one is this is interesting. Uh, what do I got? Absentee owned vacant property cash buyer owned by Memphis. Last
sale date February 2nd, 2022. Last sale price 1639. It's a three-bedroom, one bath uh in 38109. Okay, so let let me do something here. I'm gonna let's let's go ahead and update the lead details. Okay, I'm going to click this uh if this blue button right here, if it already if the the record already exists in your list, but there's updated available uh uh market data, you can click this update lead details and confirm yes. And so now the property has been updated in your lead record. So let's go over here. I'm going to refresh
the page. Whatever data needed to be updated has been now updated. And I'm going to scroll down. Um and oh here's what here's what I want to show you. I pulled up the property snapshot. Now I want to go to the more actions button and I want to go down here to generate offer. Well, let's remember what we have. We have a property in 38109 that is a if we look down here, it's a threebedroom, one bath, and it's 1521 square feet. So, it's fairly a fairly good size. Let's go generate offer. My offer price
on this property is now being generated right now by Freedomoft. Now, I did not apply a wholesale fee to this offer. So, this is what investors would pay for this house. Okay? And I'm going to let I'm going to refresh my page because this generated offer right here. Generated offer price 129,200. Now, this field will be inside of your Freedomoft account because as a uh as a buyer of the um virtual flip system training, we are unlocking the market analyzer in your account. So, this generated offer price is in a field on your dashboard somewhere
called generated offer price. Your dashboard might be set up slightly different than mine. So, you'll just have to scroll down your page and find this field. Now, you can go into your settings area of Freedomoft and move it to wherever you want. You can move this field around and put it where you want. Well, this is telling me that an investor would pay 129,200 for this house. What would I do? I would probably offer 119. I would offer a little bit less. I'd offer say $10,000 less. Now, you can adjust You can adjust this uh
in the market analyzer by updating your wholesale fee. Okay. I have a zero wholesale fee in there right now. Okay. Um Oops, I didn't mean to click that. Let me go back here. $129. Well, let's pop pop up the snapshot and let's just look at it. Okay. It last sold for 169,300 to the city of Memphis. Let me scroll down and I'm going to look at some of these properties. Um I would pro as a as an investor depending on the the uh condition of the property. Again, this is where this comes into play. You're
always going to make adjustments on this after the fact based on realworld condition, but this is averaging. This is averaging what investors are paying for three-bedroom, one bath houses in 38109. So, let me find the three bedrooms. Three bedroomedroom one baths. Here was one for 130. Here's one for uh well that one was uh that was one and a half miles away. So here's one for 3370 97 uh 30. Here's 114. Let's just look at these for a second. Let's just pop them up and take a look. Want to see how consistent they are. and
that one. And let's go. Yeah, these next this next one right here. Okay. So, if I kind of pop this scroll in here, I can see these are the ones that look like pretty similar in size to the subject. Okay, our subject property. Let's just pop up uh oh, I'm sitting on the uh snapshot right now. It looks like this little brick house uh back behind this gate. Let's look at the street view for a second. Oh, yeah. It's just a little on the on the end of a culde-sac. A nice little brick house right
there. Little brick house in this gated area. So, kind of an interesting kind of an interesting little deal. I'm going to close this down. I'm going to go to the next I'm going to go to the next record. Let's just keep going. And watch this. There's no offer generated on this one. All I have to do Well, here's a tax sale. Let's uh let's go find uh an investorowned one. Okay, here we go. Uh an investorowned one. No offer generated. I'm going to click more actions. I'm going to go generate offer. And the offer is
being generated. Now remember again I have not made any wholesale fee adjustment to this. So right now there's no uh there's no conditional adjustment and there's no wholesale fee adjustment. And so I'm taking the uh the average price per square foot at face value. Let me refresh my page because I clicked generate offer. 99200. Let's go in here and view the snapshot. Okay, now this this property was last sold for 565. Okay. Uh I'm guessing it probably needed quite a bit of work. I have no idea, but I'm guessing it probably needed work. And let's
scroll down and let's look at let's look at the comparable rents. All right. So, a lot of good rents right in the area. One, two, three, four, just a block over. So, a lot of a lot of rental comps real close. So that's that's all of those four rental comps right here, which gives me uh an average of,63. And so, you know, if you're kind of thinking about this being an investor area, this calculated offer price, if I close this down of 99 before I adjust for condition and before I adjust for the wholesale fee
is probably it's probably pretty close. Now, what's cool about this is what we've done is we've said where are investors buying, what are they buying, and so we analyze the zip code and the configuration and we said what price are they paying? We now have that in our Freedomoft account. The data is automatically here. And so it makes getting an offer and knowing what an investor would pay. So the way I've done it right now, these numbers are what an investor would likely pay to buy this house. You're going to offer a little bit less.
And you'll see that in the market analyzer. uh how you can adjust your settings to add a wholesale fee and had and add a condition adjustment like a repair cost. Um, and what I'll usually do is I'll usually add in a a $10,000 seven to $10,000 wholesale fee and I'll usually add in a $ 15 to $20,000 uh repair estimate uh fee or repair fee um to automatically adjust my generated offer so that it gets me the offer that I know that I want to make. I wanted to show you in this video that with
no adjustment, the generated offer price is what an investor is likely to pay. It's what your buyer will pay for this deal. Now, again, you have to adjust for condition. You have to adjust for wholesale fee for your offer. Here's what I want to do is I want to take you back here and I want to show you something pretty cool. Once you've set up your your market analyzer and your dynamic offer generator, um, and you've done it, uh, you've set your settings, you've gone through, you've analyzed your zip codes, you've gone through and you've
put your investor eye on the data. Does the data look right? Is it does it feel like it's does it feel good? Then you can come in here and say, you know what, select all 1424 records. Now, I'm gonna just go ahead and select the first page. I'm going to select 20. You can go right here to more actions and you can go right down to generate offer. What Freedomoft is doing right now is, excuse me, is it is analyzing all of these addresses that I just selected and it's starting to calculate your offers. And
you can see it's starting to go through and analyze this. As I keep refreshing the page, it's going to fill these in. And it's going to keep going and it's going to keep filling them in. So, a property that does not need repairs and is not being bought at your wholesale fee margin. This is what an investor would pay for each one of these. And one more refresh and I should get my my my top 20. These are the 20 that I selected. What I want you to understand is that you can do this in
any market in the country, any any city in the country. And if you don't know anything about the market, this is how you work this business virtually. If you get a new lead from some random city or some area across the country, you can go into Freedomoft, go over to the tools, click on market analyzer and say, "Hey, run me a new market." And let's say that I just got a new lead in Colorado. And let's say I got that lead in uh the Denver area. I'm going to go ahead and I'm just going to
run I want to analyze the market. So, I'm going to go in here and I'm going to run this market analyzer. Uh, and it runs off of Zipfinder. So, we're going to go in and we're going to analyze the market. And I'm going to show you how this kind of comes full circle. As soon as I'm done with the market analysis and Freedomoft is right now pulling all of the data in, organizing it, configuring it, figuring out what is this data telling us. Soon as it's done, I'm going to click analyze market. If you got
a random lead, if you were working a a random area, if you had a wholesaler uh uh show you a deal, you're like, I wonder I wonder if that's a good deal. I wonder if it I wonder if that deal would work. This is how you can do it. You can go into Freedomoft, you can run a market analysis, and as soon as we analyze the market, we're going to get the price per square foot that investors are paying. And so it just analyzed the market. I now have my top zip codes, but I'm just
going to click analyze. And I'm going to name this Denver MSA. I'm going to click analyze now. And what it's doing is it's going through and it's showing me that this market is currently pending. And it's going to go pull all of that sold data, all of the zip codes, all of the property configurations, bedrooms, bathrooms, and the square footage, and it's going to calculate a price per square foot that investors are paying in any market in the country. You can now run this, and you can see what investors are paying. So, let me refresh
my page here. Okay, the market has now been analyzed. You see, it doesn't take that long. It's pretty amazing. I'm going to click into the Denver MSA, and I can now see, okay, these big high uh numbers, these these are going to get scrubbed. Uh any anomalies are going to get scrubbed. And we're going to go to the offer generator. And let's just say that I had a lead uh from uh let's see, I'm going to pick I I know this. I know the market. So, I'm going to go 80011. Okay. So, I have a
lead. Let's say that I have a lead on a two-bedroom, one bath house that's 800 square ft for uh in in uh 80011. So, here it is right here. I've got a twobedroom, one bath lead. What are investors paying? Whoops. Trying to do this left-handed. Uh, what are investors paying? They're paying 278 bucks a square foot. So, let's say that I have an 800 square f foot, two-bedroom, one bath times 277. Investors are paying for that deal $221,000. 277 uh.76 times 800 square ft. $222,000. Okay, that's what they're paying. You now you have the ability
now to to run that math anywhere in the country as you get a lead. Now the entire country becomes your oyster and you're equipped quickly and accurately with data to say I could go in and find the the zip code property configuration and find out what investors are paying on on any deal in the country. Now as part of the virtual flip system, we're going to focus in on generating leads in your top three areas. So, you picked you ranked your market. You picked your top three markets and you're going to launch your first one.
You're going to go into Freedomoft. You're going to run this analysis. And then as you start to uh go through the process that I just went through, you're going to get your lists and you're going to have your sellers Memphis top three zips vacant. And you can now view all of these. And if you run the offer generator, it calculates an offer. Pretty cool. Now, I'm going to take you back one other place. I want to take you back and I want to show you to go to my lists because let's go back to the
Memphis active buyers top three zips. Now, I'm going to edit this because I I named it a little different. The other time uh on the on the sellers I did it like this. I said sellers Memphis top three zips vacant. I'm going to do it the same. Buyers Memphis top three zips active buyers. Okay. And I'm going to go ahead and click save changes. That updates it. There you go. There shows you my OCD. Now look at they're named exactly the same. Sellers and buyers in that area. Now, if you remember back the top three
zips active buyers, it was like 600 and some active buyers on the the list, but we only got 455 unique buyers. Here's what that means. That means that some of these buyers are buying more than one house. Okay? We have we have active buyers that are buying more than one deal. Now, when we get to when we get to the seller the the the acquisitions module, I'm going to show you what to do with your top three vacants zip list. I'm gonna show you how to start generating leads off of that list. When we get
to the buyer module, I'm going to show you how to find the most active buyers that are buying the types of deals you want. Okay? In these top three zips, we now have the top three zips with the observable distressed inventory. And you can see there's plenty of it that you're going to do the top 10 zips. I only did the top three. Then we're going to go and we're going to find all the buyers that are matching up and are actually buying and we're we're going to go make deals happen. When you start to
do this and you do it intentionally in your easy profit city, you win at this business. And we're going to take you through the acquisitions process. We're going to take you through the dispositions process. We're going to show you how to make that match and get paid and then we're going to show you how to build and scale out your team. But we now know as part of this module griding the market by starting with Zipfinder, analyzing the market and then going through our offer generator. We know where investors are buying. We know what they're
buying because it built all my configurations of everything that investors are buying and we know what price they're paying because we automatically got a price per square foot analysis. We now have the three most important bits of data to help us get deals at the right price so that we can sell them when we get into the buyer module and I show you who who are the buyers. We don't need a hundred buyers. We don't need 50 buyers. We need three to five buyers buying two to three deals a month. I'm going to show you
how to find those people and start selling them deals consistently. That's the secret to this whole business. Now, let's go back here for a second because let's talk about your next steps. Your next steps are to grid your market. You went through the process in module two of ranking markets. You picked a market. What? Take your number one, number two, number three. pick your first market and go into Freedomoft and run this analysis. Add a new market um and and grid it out. Then I want you to review the data, the raw data, and analyze
the calculated price per square foot in your top 10 zip codes. Okay? Look for outliers and make those adjustments like I showed you here. Then get ready to build your first seller list and start marketing. Now you can take that next step. You can go back to the zipfinder analysis and pick your top 10 zip codes and say find sellers. Click that button. Click your top 10 zip codes. Click find buyers. Build your two lists because that's going to set up module number four and module number five. Acquisitions and dispositions. Go through the process. This
is your next step. analyze your market, make the adjustments, build your seller list and your buyer list just like I showed you here. And then we're going to come back in the next module and we're going to break it all down and we're going to show you how to launch an acquisitions machine. All right, guys. This is Rob Swanson for the virtual flip system, uh, module number three. Go make it happen.

![Best of Deep House [2026] | Melodic House & Progressive Flow](https://i.ytimg.com/vi/Il-ZpBuC8tA/mqdefault.jpg)