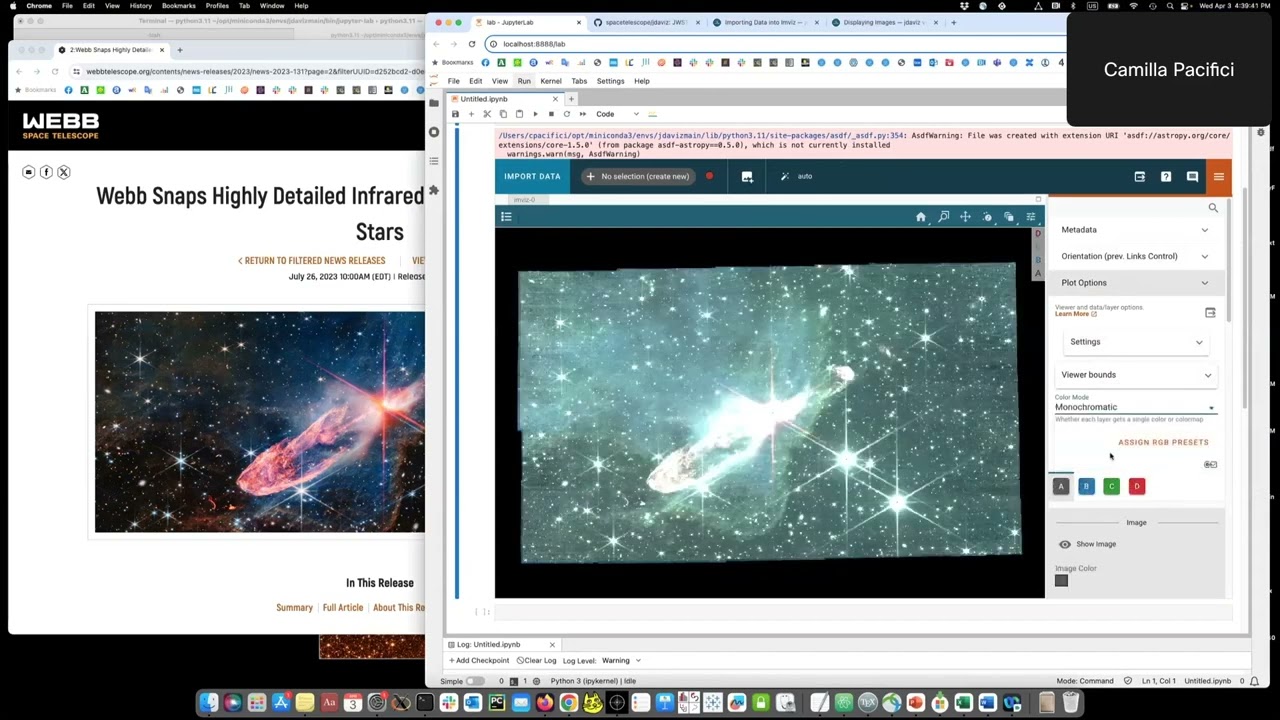
This video is the second in a series on ImViz. We will demonstrate a common practice of overplotting markers corresponding to a catalog. In this instance, the photometry catalog output from the JWST pipeline.
Like before, we want to make sure we are working with the desired image. We can blink the images by adding a command into the Jupyter Notebook or by hovering the mouse and pressing the B button. Once we've selected our image, we will overlay a catalog taken from the JWST pipelines' Escape V file.
The catalog is shown in green circles. We can use the Zoom tool to narrow in on a part of the sky the circles show the centroid of the sources. We can zoom back out by hitting the home button.
Then we remove the markers using the notebook. In our next video, we will demonstrate how to open two windows within a single instance of ImViz and align images by WCScoordinates.











![[AUTOML24] Manual and automatic preprocessing tables for machine learning, with scikit-learn & skrub](https://img.youtube.com/vi/kyCj8jrYAxs/maxresdefault.jpg)